


Summary: Do not use mapvar=yes on step 1 of a POL-2 reduction as it can cause negative bowling around bright sources in the I map created at step 2.
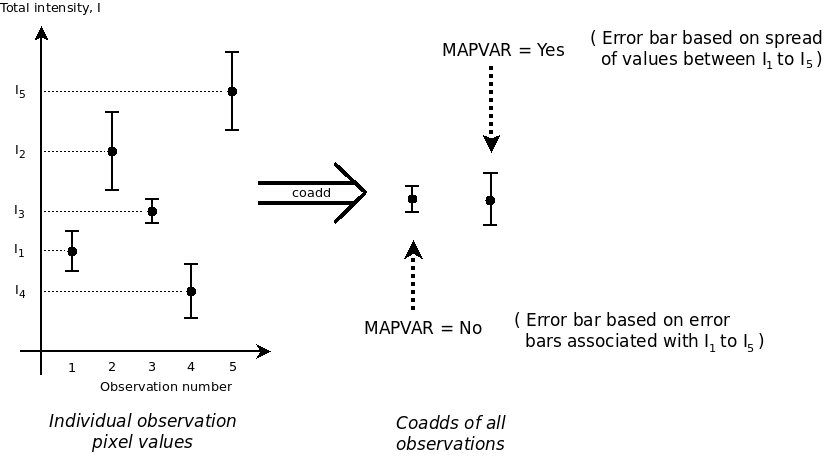
Production of polarisation maps from POL-2 data is usually performed using the pol2map command within the Starlink SMURF package, as described in the POL-2 Data Reduction cookbook – SC22. An option is available to create the final I, Q and U variances based on the spread of pixel values in a set of maps created from different individual observations. This option is selected by running pol2map with the parameter setting mapvar=yes. Without this option, output variances are calculated using simple error propagation from the variance values stored within the maps made from individual observations.
When creating POL-2 polarisation maps, it is usual first to run pol2map in ”auto-masking” mode to create an initial map of total intensity (I). This initial map is used simply to define a mask outlining the areas on the sky where bright emission is expected. This mask is then used in subsequent runs of pol2map to (amongst other things) exclude bright bolometer samples from the estimation of the COM, PCA and FLT background levels – including bright samples would bias these estimates. The first run of pol2map is usually referred to as “step 1”, with subsequent runs being “step 2” and “step 3”. The I map created by step 1 is first converted from total intensity (in pW) into a map of signal-to-noise ratio (SNR). This is done by dividing the pixel data values by the square root of the pixel variance values. This SNR map is then thresholded at a specific value to define the mask containing the source areas.
But the size of the pixel variance values, and consequently the SNR values and the resulting mask, depends on whether the mapvar=yes option was used when running pol2map. In general, using mapvar=yes causes the variances to be higher, meaning that the SNR values are lower. So there are fewer source pixels above the SNR threshold value. Thus, the mask is less effective at excluding bright bolometer samples from the various background estimates. This means the background is over estimated in the vicinity of bright sources, resulting in negative bowling around bright sources when the background is removed. For obvious reasons this effect is worse for brighter sources than for weaker sources.
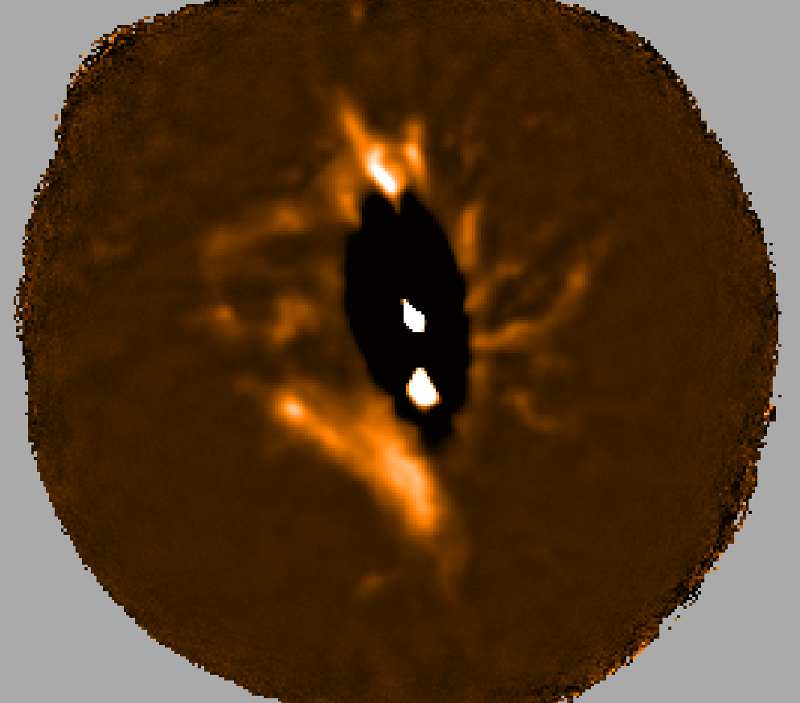
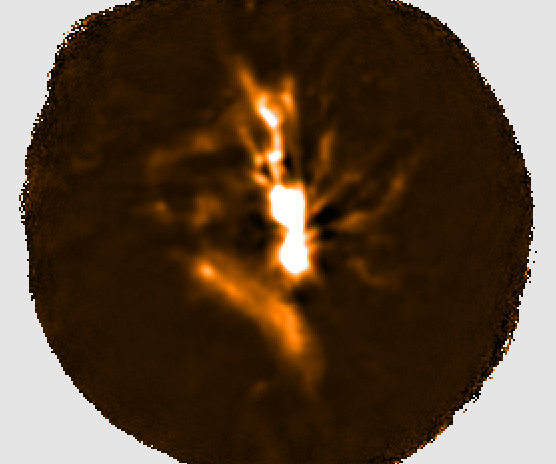
Below are examples of the the externally masked I map created at step 2, based on step 1 I maps created using mapvar=yes (left) and mapvar=no (right). The negative bowling in the centre of the left image is obvious (images provided by Kate Pattle).