EAO and ‘Imiloa provide ‘Stellar’ Night to local Cub Scouts

On Saturday, March 7th, 2020, the ‘Imiloa Astronomy Center in Hilo, Hawai’i hosted 70 visitors for a special overnight event.  As part of the “Stellar Night at the Museum”, the Cub Scouts and their family members were treated to a unique visit at the East Asian Observatory base facility.

Courtesy photo provided to the Hawaii Tribune Herald from the Cub Scouts who attended the Scouts Stellar Night at the Museum overnight March 7 at ‘Imiloa Astronomy Center in Hilo.


Telescope System Specialist, Alexis Acohido, provided tours into the JCMT Control Room as live operations were taking place. Photo taken by Emily Peavy.


Extended Operator, Patrice Smith, engaged the visitors with a fun “Alien Eyes” activity that demonstrated how filters can help us sort out information that we wouldn’t be able to normally see with our eyes. Photo taken by Emily Peavy.


EAO Visiting Scientist, Pablo Torne, used spectral tubes and diffraction gratings to explore spectral lines from different molecules. Photo taken by Emily Peavy.


In the UKIRT control room, Telescope Operators Jess Stasik and Michael Pohlen used an infrared camera and a cell phone to explore heat. Photo taken by Emily Peavy.

An article was released in the local Hawaii Tribune Herald newspaper about the event, and can be read here:

www.hawaiitribune-herald.com/2020/04/14/community/scouts-have-a-stellar-night-at-the-museum/?fbclid=IwAR1_Glc82elyoAlbRh84_q4z6x_-1J3FlZ0kuGoXuE4jYoJrgM1sgMH9B9E


pol2map now adds an AST column to the output catalogue

The pol2map command used to create I, Q, U maps and vector catalogues from POL2 data now  adds a column called “AST” to the output catalogue. This new column holds an integer for each row, indicating if the row is inside (1) or outside (0) the AST mask. It uses the poledit command in the Starlink POLPACK package, as described in an earlier post.

A possible use of this new column would be to select the vectors corresponding to the inside of the AST mask when viewing the vector map in GAIA. To do this, the selection criterion “$ast == 1” should be used within the GAIA polarimetry toolbox.

Changing the de-biasing in a POL2 vector catalogue

The new poledit command in the Starlink POLPACK package (see a previous blog post) has an option to recalculate the PI (polarised intensity) and P (percentage polarisation) values using a specified form of de-biasing. If the existing catalogue is in file “mycat.FIT“, you can do:

% polpack
% poledit mycat newcat mode=debias debiastype=mas

This will create a new file “newcat.FIT” containing a copy of “mycat.FIT“, but with new P and PI columns re-calculated from the existing Q, U, I and DPI values using the “Modified Asymptotic” (MAS) bias estimator (any de-biasing used to create the original catalogue is ignored). The options for the DEBIASTYPE parameter are:

  • “MAS”: De-bias using the modified asymptotic estimator
  • “AS”: De-bias using the asymptotic estimator
  • “None”: Do not include any de-biasing

See a previous blog post for more on these types of de-biasing.

The following plot shows the results of using the above command. The horizontal axis is PI/DPI (polarised intensity signal to noise ratio) with no de-biasing. The vertical axis is the new PI/DPI value created with each of the DEBIASTYPE options listed above (red is “AS”, blue is “MAS” and green is “None”)

Adding an AST mask column to a POL2 vector catalogue

A new command called poledit has been added to the Starlink POLPACK package and will be available in Starlink builds made after 10:00 UTC on 15th April 2020. It allows a vector catalogue to be changed in several different ways, as specified by the MODE parameter (new forms of edit will no doubt be added in the future). One of the available options is to add a new column to the output catalogue containing values read from an NDF. This option is divided into two sub-options – one that stores the values from the NDF directly in the new column, and another that stores a boolean flag in each row of the new column indicating whether the corresponding NDF pixel had a good value or not (i.e. was not set to the “bad” value – the Starlink equivalent of NaN).

This second sub-option (selected using the poledit MASKCOL parameter) can be used to create a column in a POL2 catalogue that indicates which vectors are inside the AST mask. If your catalogue is “mycat.FIT”, then do:

% polpack
% poledit mycat newcat mode=AddColumn col=AST ndf=astmask maskcol=yes

where “astmask.sdf” is an existing NDF that was created by pol2map at step 2 or 3 using the  MASKOUT1 parameter. The above command will create a new catalogue in file “newcat.FIT” containing a copy of “mycat.FIT” with an additional column called “AST”. This new column will contain the value zero for each row that has a bad value in “astmask.sdf” (i.e. is outside the AST mask) and the value one for all other rows.

By default, the catalogue and NDF are aligned in (RA,Dec) – that is, the (RA,Dec) values for each row in the catalogue are used to determine the NDF pixel that corresponds to the row. There is an option to align in pixel coordinates instead using the (X,Y) columns in the catalogue.

The Event Horizon Telescope brings the world together to observe new mysteries in quasar 3C 279

First Event Horizon Telescope Observations of a Black-Hole Powered Jet announced as Maunakea Observatories offer MKO@Home online resources

Two Hawai’i-based telescopes, the James Clerk Maxwell Telescope (JCMT), operated by the East Asian Observatory, and the Submillimeter Array (SMA), operated by the Smithsonian Astrophysical Observatory and the Academia Sinica Institute for Astronomy and Astrophysics, have once again provided crucial information in the global effort to understand Black Holes. The JCMT and SMA linked up with six other telescopes around the world to form the Event Horizon Telescope (EHT), in an effort involving hundreds of astronomers and engineers. The black hole targeted in these observations resides at the centre of a galaxy called 3C 279. This galaxy is 5 billion light years away in the direction of the Virgo constellation.

Nearly one year ago, the JCMT and the SMA played a vital role in the groundbreaking EHT observational campaign to observe the very first image of a black hole, which was given the Hawaiian name Pōwehi. The EHT collaboration is excited to announce this new result from data obtained at the same time as the Pōwehi result.

For the first time, astronomers have observed a jet travelling at close to the speed of light, that is believed to originate from the vicinity of a supermassive black hole, in unprecedented detail. In their analysis, led by astronomer Jae-Young Kim from the Max Planck Institute for Radio Astronomy in Bonn (MPIfR), the collaboration studied the exquisite detail of the jet’s shape close to the base. The jet base is a fascinating region where highly variable, high energy gamma-ray emission is thought to originate.

The results will be published in the coming issue of the prestigious journal ​Astronomy & Astrophysics​.


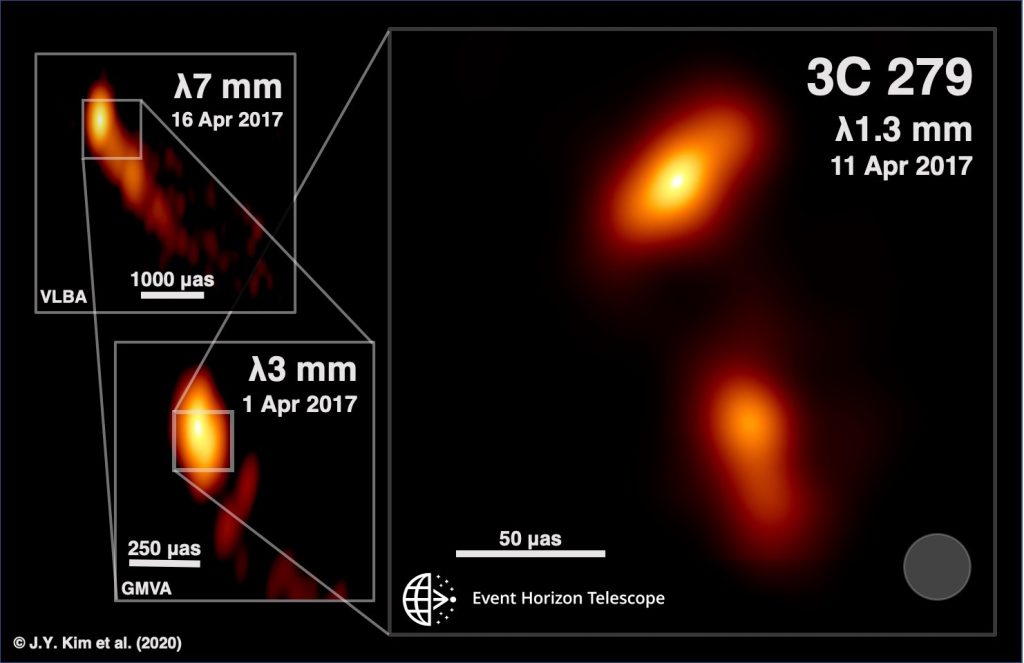
Fig. 1: Illustration of 3C 279 jet structure in April 2017. The observing epochs, arrays, and frequencies are noted at the top of each panel. Credit: J.Y. Kim (MPIfR) & the Event Horizon Telescope Collaboration


The black hole targeted in these observations is called 3C 279. It resides at the centre of a galaxy 5 billion light years away in the direction of the constellation Virgo. Scientists classify this galaxy as a quasar because it shines ultra-bright and flickers, signifying that massive amounts of gases and stars are falling into the giant black hole at the centre. The black hole in 3C 279 is about one billion times the mass of our own sun. Any material such as stars, gas, or dust that comes close to this black hole is shredded by strong gravitational forces, causing a large donut-shaped structure known as an accretion disc to form around the object. But not all of this shredded material stays in the accretion disc or ends up falling into the Super Massive Black Hole. Some of the material will be squirted back out into space in two fine fire-hose-like jets of plasma, travelling at speeds near the speed of light. These jets are powerful and demonstrate the enormous forces at play in the centre of this galaxy.

Through linking up many telescopes across the globe, using a technique known as very long baseline interferometry (VLBI), the astronomers are able to see the jet and accretion disc in action, distinguishing the sharpest-ever details in the jet. The new jet images, probing size scales finer than a light-year, show an unexpected twisted shape at its base, and features perpendicular to the jet, which could represent the poles of the accretion disc from where jets are ejected. Through comparing the images of 3C 279 over subsequent days, the astronomers see the finest details changing, opening up the possibility that we are actually seeing both the rotation of the accretion disc (with the shredding and infall of material), and the jet ejection, that has previously only been modeled in computer simulations of these objects.

Jae-Young Kim, leader of the analysis, is enthusiastic and at the same time puzzled: “We knew that every time you open a new window to the Universe you can find something new. Here, where we expected to find the region where the jet forms by going to the sharpest image possible, we find a kind of perpendicular structure. This is like finding a very different shape by opening the smallest Matryoshka doll.” Furthermore, the fact that the images change so fast has also surprised astronomers. “These jets show apparent motions faster than the speed of light (called superluminal motion), as an optical illusion, but this, perpendicular to the expectation, is new and requires careful analysis”, adds Jae-Young-Kim.

The interpretation of these observations is challenging. In particular, observing apparent motions of about 20 times the speed of light in the jet are difficult to reconcile with the early understanding of the source. These results paint a complex picture, where disturbances in the flow of material, known as shocks, are travelling down a bent (and possibly rotating) jet, and producing incredibly high energy gamma-rays.

“To announce this incredible result exactly a year after we brought Pōwehi to the world makes it so special,” offers Jessica Dempsey, Deputy Director of the James Clerk Maxwell Telescope – one of the two Hawaii-based observatories that are part of the EHT. “For our staff here in Hawaii, it is a reminder of the ground-breaking work they continue to contribute to – even if we aren’t up at the summit right now. Like Pōwehi before it, this beautiful image of 3C 279 gives me hope, for us and for our future.”

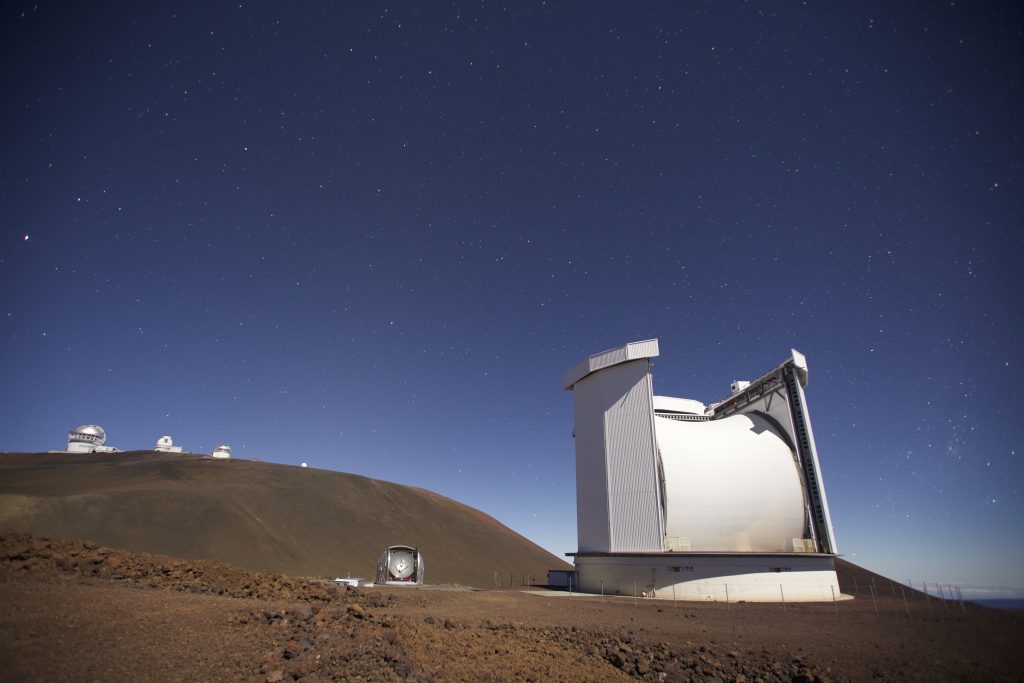
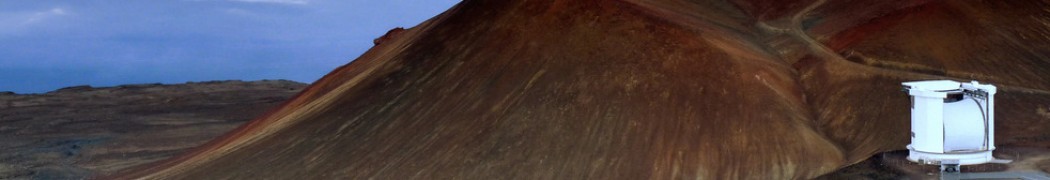
Fig. 2: The James Clerk Maxwell Telescope (JCMT) located on the slopes of Maunakea, Hawai`i is pictured in the foreground. The JCMT is operated by the East Asian Observatory. Credit: Will Montgomerie

Anton Zensus, Director at the MPIfR and Chair of the EHT Collaboration Board, stresses the achievement as a global effort: “Last year we could present the first image of the shadow of a black hole. Now we see unexpected changes in the shape of the jet in 3C 279, and we are not done yet. We are working on the analysis of data from the centre of our Galaxy in Sgr A*, and on other active galaxies such as Centaurus A, OJ 287, and NGC 1052. As we told last year: this is just the beginning.”

The March/April 2020 observing campaign of the EHT was cancelled due to the CoViD-19 global outbreak. The EHT Collaboration is now determined on the next steps to follow both in new observations and in the analysis of existing data. Geoff Bower, EHT Project Scientist based at the SMA facility in Hilo concludes: ​“This is a small piece of good news during this challenging time. We’re very happy to share with the world results from telescopes on Maunakea and around the globe the insights that we have made into black holes, the most exotic objects in the Universe. Both the SMA and the JCMT produced essential data to make these spectacular images, just as they did for Pōwehi. Stay tuned for new discoveries in the year still to come!”

Here in Hawaii, the state’s effort to “flatten the curve” in the fight against CoViD-19 means that many families now have children – keiki – distance learning at home. Together the Maunakea Observatories are supporting our community by providing online STEM resources for schools, teachers and families. The MKO@Home initiative was launched on March 23rd providing educational videos each Monday, Wednesday and Friday. Topics covered include careers, the solar system, recent discoveries, arts and crafts and more. This week MKO@Home will offer a range of activities and lessons involving Black Holes with a culminating event on April 10th, the State of Hawaiʻi’s Pōwehi Day. Four astronomy professionals will host a live panel discussion at 1:00pm HST answering viewers’ questions on all things astronomy and Black Hole related.


Further Information (Links):

Event Horizon Telescope
http://www.eventhorizontelescope.org/

First Image of a black hole, Poōwehi, obtained by the EHT (April 2019)
https://www.eaobservatory.org/jcmt/2019/04/powehi/

James Clerk Maxwell Telescope
https://www.eaobservatory.org/jcmt/

Pōwehi Day proclamation
Governor Ige declares April 10th – Pōwehi Day

MKO@Home on YouTube
http://bit.ly/mkoathome


Background Information:

The international collaboration announced the first-ever image of a black hole, Pōwehi, by creating a virtual Earth-sized telescope at the heart of the radio galaxy Messier 87 on April 10, 2019. Supported by considerable international investment, the EHT links existing telescopes using novel systems — creating a new instrument with the highest angular resolving power that has yet been achieved.

The individual telescopes involved in the EHT collaboration are at present: the James Clerk Maxwell Telescope (JCMT), the Submillimeter Array (SMA), ALMA, APEX, the IRAM 30-meter Telescope, the IRAM NOEMA Observatory (expected 2021), the Kitt Peak Telescope (expected 2021), , the Large Millimeter Telescope (LMT),, the Submillimeter Telescope (SMT), the South Pole Telescope (SPT), and the Greenland Telescope (GLT, since 2018).

The telescopes work together through a VLBI technique. This synchronises facilities around the world and exploits the rotation of our planet to form one huge, Earth-size telescope. VLBI allows the EHT to achieve a resolution of 20 micro-arcseconds — equivalent to identifying an orange on Earth as seen by an astronaut from the Moon. The data analysis to transform raw data to an image required specific computers (or correlators), hosted by the MPIfR in Bonn and the MIT Haystack Observatory.

The EHT consortium consists of 13 stakeholder institutes; the Academia Sinica Institute of Astronomy and Astrophysics, the University of Arizona, the University of Chicago, the East Asian Observatory, Goethe-Universität Frankfurt, Institut de Radioastronomie Millimétrique, Large Millimeter Telescope, Max-Planck-Institut für Radioastronomie, MIT Haystack Observatory, National Astronomical Observatory of Japan, Perimeter Institute for Theoretical Physics, Radboud University and the Smithsonian Astrophysical Observatory.


Original Paper:

J.Y. Kim, T.P. Krichbaum, A.E. Broderick, et al.: Event Horizon Telescope imaging of the archetypal blazar 3C 279 at an extreme 20 microarcsecond resolution, in: Astronomy & Astrophysics, April 2020
https://doi.org/10.1051/0004-6361/202037493


Contact:

Dr. Jessica Dempsey
James Clerk Maxwell Telescope, East Asian Observatory
Email: j.dempsey@eaobservatory.org

Dr. Jae-Young Kim
Max-Planck-Institut für Radioastronomie, Bonn.
Fon: +49 228 525-431
E-mail: jykim@mpifr-bonn.mpg.de

Explore the universe from home with Maunakea Observatories

This article appeared in the University of Hawai’i News on April 6th

In response to the interruption of hands-on science education and outreach during the COVID-19 crisis, the Maunakea Observatories (MKO) have unveiled a distance learning program, MKO@Home online. The virtual project consists of short weekly videos that feature astronomy related activities, demonstrations and interviews.

“The Maunakea Observatories recognize the severe educational difficulties that COVID-19 is creating for the community, and we are doing as much as we can to address this challenge. We are rallying all of our outreach resources and will be presenting as much content as possible during this unprecedented crisis,” said Bob McLaren, University of Hawaiʻi Institute for Astronomy interim director.

MKO@Home videos featuring scientists and educators are designed to allow K–12 students and families to explore the universe from home.

Content for the pilot program ranges from lessons on the night sky, to Pōwehi, the now-famous supermassive black hole. The cosmic wonder was given a name in ʻōlelo Hawaiʻi or Hawaiian language by UH Hilo professor Larry Kimura. The name recognizes the instrumental role that observatories on Maunakea played in the worldwide effort to capture an image of a black hole for the first time in history.

Dr Harriet Parsons, presents “exploring Shadows” as part of MKO@Home

April 6–10, MKO@Home will celebrate Black Hole Week and feature demonstrations by Maunakea astronomers about the mysterious objects.

MKO@Home videos are uploaded three times a week on Mondays, Wednesdays and Fridays.

  • For more, go to Maunakea Observatories.
  • To watch all of the EAO videos on MKO@Home and more, visit our Videos page here.
  • Subscribe to the MKO@Home videos on the Maunakea Observatories YouTube Channel here.

Change to the default IP model used by pol2map

As of SMURF version 1.7.0, the default Instrumental Polarisation (IP) model used by the pol2map command   has changed from “JAN2018” to “AUG2019”. Thus, if you do not assign a value to the “ipmodel” configuration parameter when running pol2map, the AUG2019 model will now be used rather than the JAN2018 model. If you wish to continue using the JAN2018 model, you must add “ipmodel=JAN2018” to the configuration used when pol2map is run. For instance:

% pol2map config='ipmodel=JAN2018'

See the blog post “New IP models for POL2 data” for more information about these IP models. Compared to the JAN2018 model, the AUG2019 model significantly improves the consistency between 450 um maps taken at different elevations. At 850 um, the differences between the two models are generally lower than the noise.

New de-biasing method for POL2 data

Calculation of the polarised intensity (PI) and percentage polarisation (P) values from measurements of I, Q and U usually need to be corrected to take account of the bias towards larger values caused by the presence of noise (particularly noticeable  in areas of low signal-to-noise). This bias occurs because of the squaring of Q and U involved in calculating PI:

PI = √( Q2 + U2 )

Thus both positive and negative Q and U values give a positive PI value, pushing the mean PI value upwards. A correction for this effect is applied if the parameter setting “debias=yes” is specified when running the SMURF pol2map command (note, the default is “debias=no“). To date, this correction has used the so-called “asymptotic estimator” (AS):

PIAS = √( Q2 + U2 – σ2 )

where σ2 is the weighted mean of the variances on Q and U:

σ2 = ( Q2Q2 + U2U2 ) / ( Q2 + U2 )

However, this estimator has the problem that it becomes undefined when

Q2 + U2 < σ

The usual practice is to use an exact value of zero for the PI at such points. However, this can upset the PI noise statistics in very low SNR regions.

However, there are other forms of de-biasing that avoid this problem, such as the “modified asymptotic estimator” (MAS) described by Plaszczynski et al  (MNRAS 2014).   The de-biased MAS estimate of PI is defined by

PIMAS = PI – 0.5*σ2*( 1 – e-(PI/σ)2)/PI

where PI is √( Q2 + U2 ). The PIMAS value is defined for all non-zero PI. The following figure shows PIAS  (blue) and PIMAS (green) plotted against uncorrected PI, assuming σ= 1:

The MAS estimator may now be used in pol2map by adding “debiastype=mas” to the pol2map command line. Note, the default de-biasing method is still the asymptotic estimator. Using the MAS estimator may facilitate investigation of PI noise statistics in low SNR areas.


Checking errors in POL2 vector catalogues

A new command called pol2noise has been added to the Starlink SMURF package. It allows the error values stored in a POL2 vector catalogue to be checked for consistency. For instance, to check the errors on the Q column, do:

% smurf
% pol2noise mycat.FIT Q

replacing myfit.FIT with the name of your vector catalogue (“Q” can be replaced by U, I or PI). It will display three pictures on the current KAPPA graphics device.  So for instance, to use an xwindow graphics device, you can either use KAPPA:gdset to set xwindows as the default graphics device prior to running the above commands:

% kappa
% gdset xw

or you can specify the device directly on the pol2noise command line:

% pol2noise mycat.FIT Q device=xw

This will produce an X window showing something like this:

The left hand picture shows the noise level in the background regions determined from the local variation between the Q values in the catalogue. The middle picture shows the noise level recorded in the DQ column of the catalogue. The right hand picture is a scatter plot of the values in the other two pictures. The best fit line is shown in red (the slope and intercept of this line,together with the RMS residual, is displayed on the terminal screen when pol2noise ends). The upper limit of the data included in the scatter plot is shown as a red contour in the two images.

For more information on the available options and how pol2noise determines the background regions and the displayed noise levels, do:


% pol2noise --help


POL2 vector catalogues now contain more rows

A change has been made recently to the contents of vector catalogues created using the pol2map command in the Starlink SMURF package. Previously, sky positions that have a negative total intensity (I) value were excluded completely from the catalogue (such positions occur frequently in background regions because of noise). Now, these positions are included in the catalogue, albeit with a null value for the percentage polarisation (P) column and associate error column (DP).  This change simplifies the interpretation of column statistics in the background regions, since it removes the bias introduced by the exclusion of position with negative I values.