On July 1st, 2021 the two-component SCUBA-2 beam profile parameters were updated in accordance with the results published by Mairs et al 2021. This caused a change in the Matched Filter post-processing.
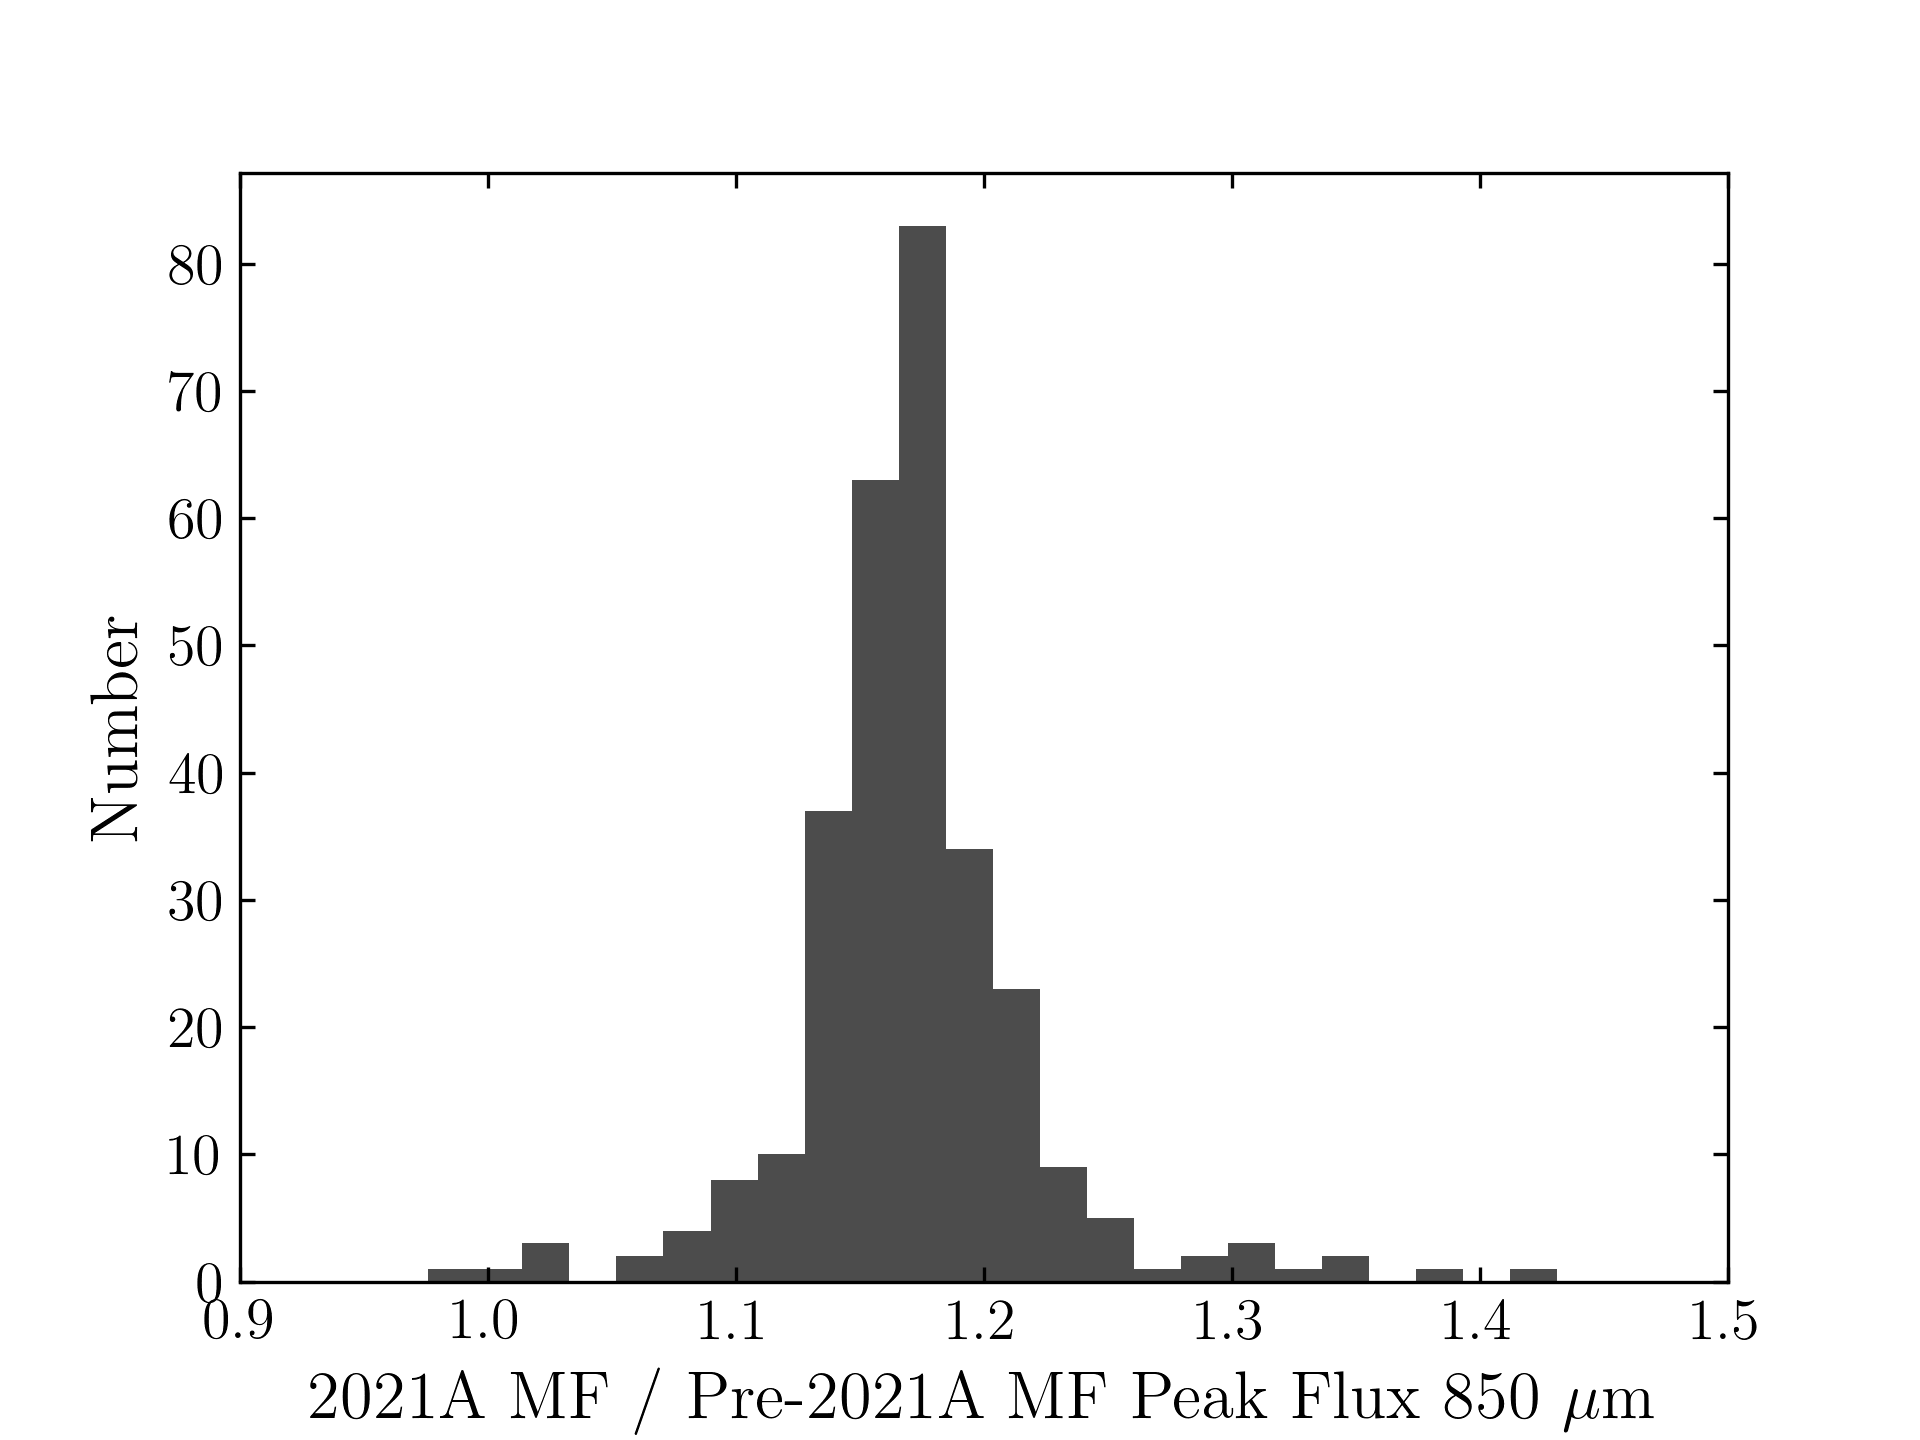
When using a Stardev installation post-July 1st, 2021, executing the matched-filter method is expected to increase the measured peak fluxes of bright point sources by ~15% relative to older versions of Starlink. A similar factor may apply to faint point sources in otherwise “blank fields” but this requires further testing.
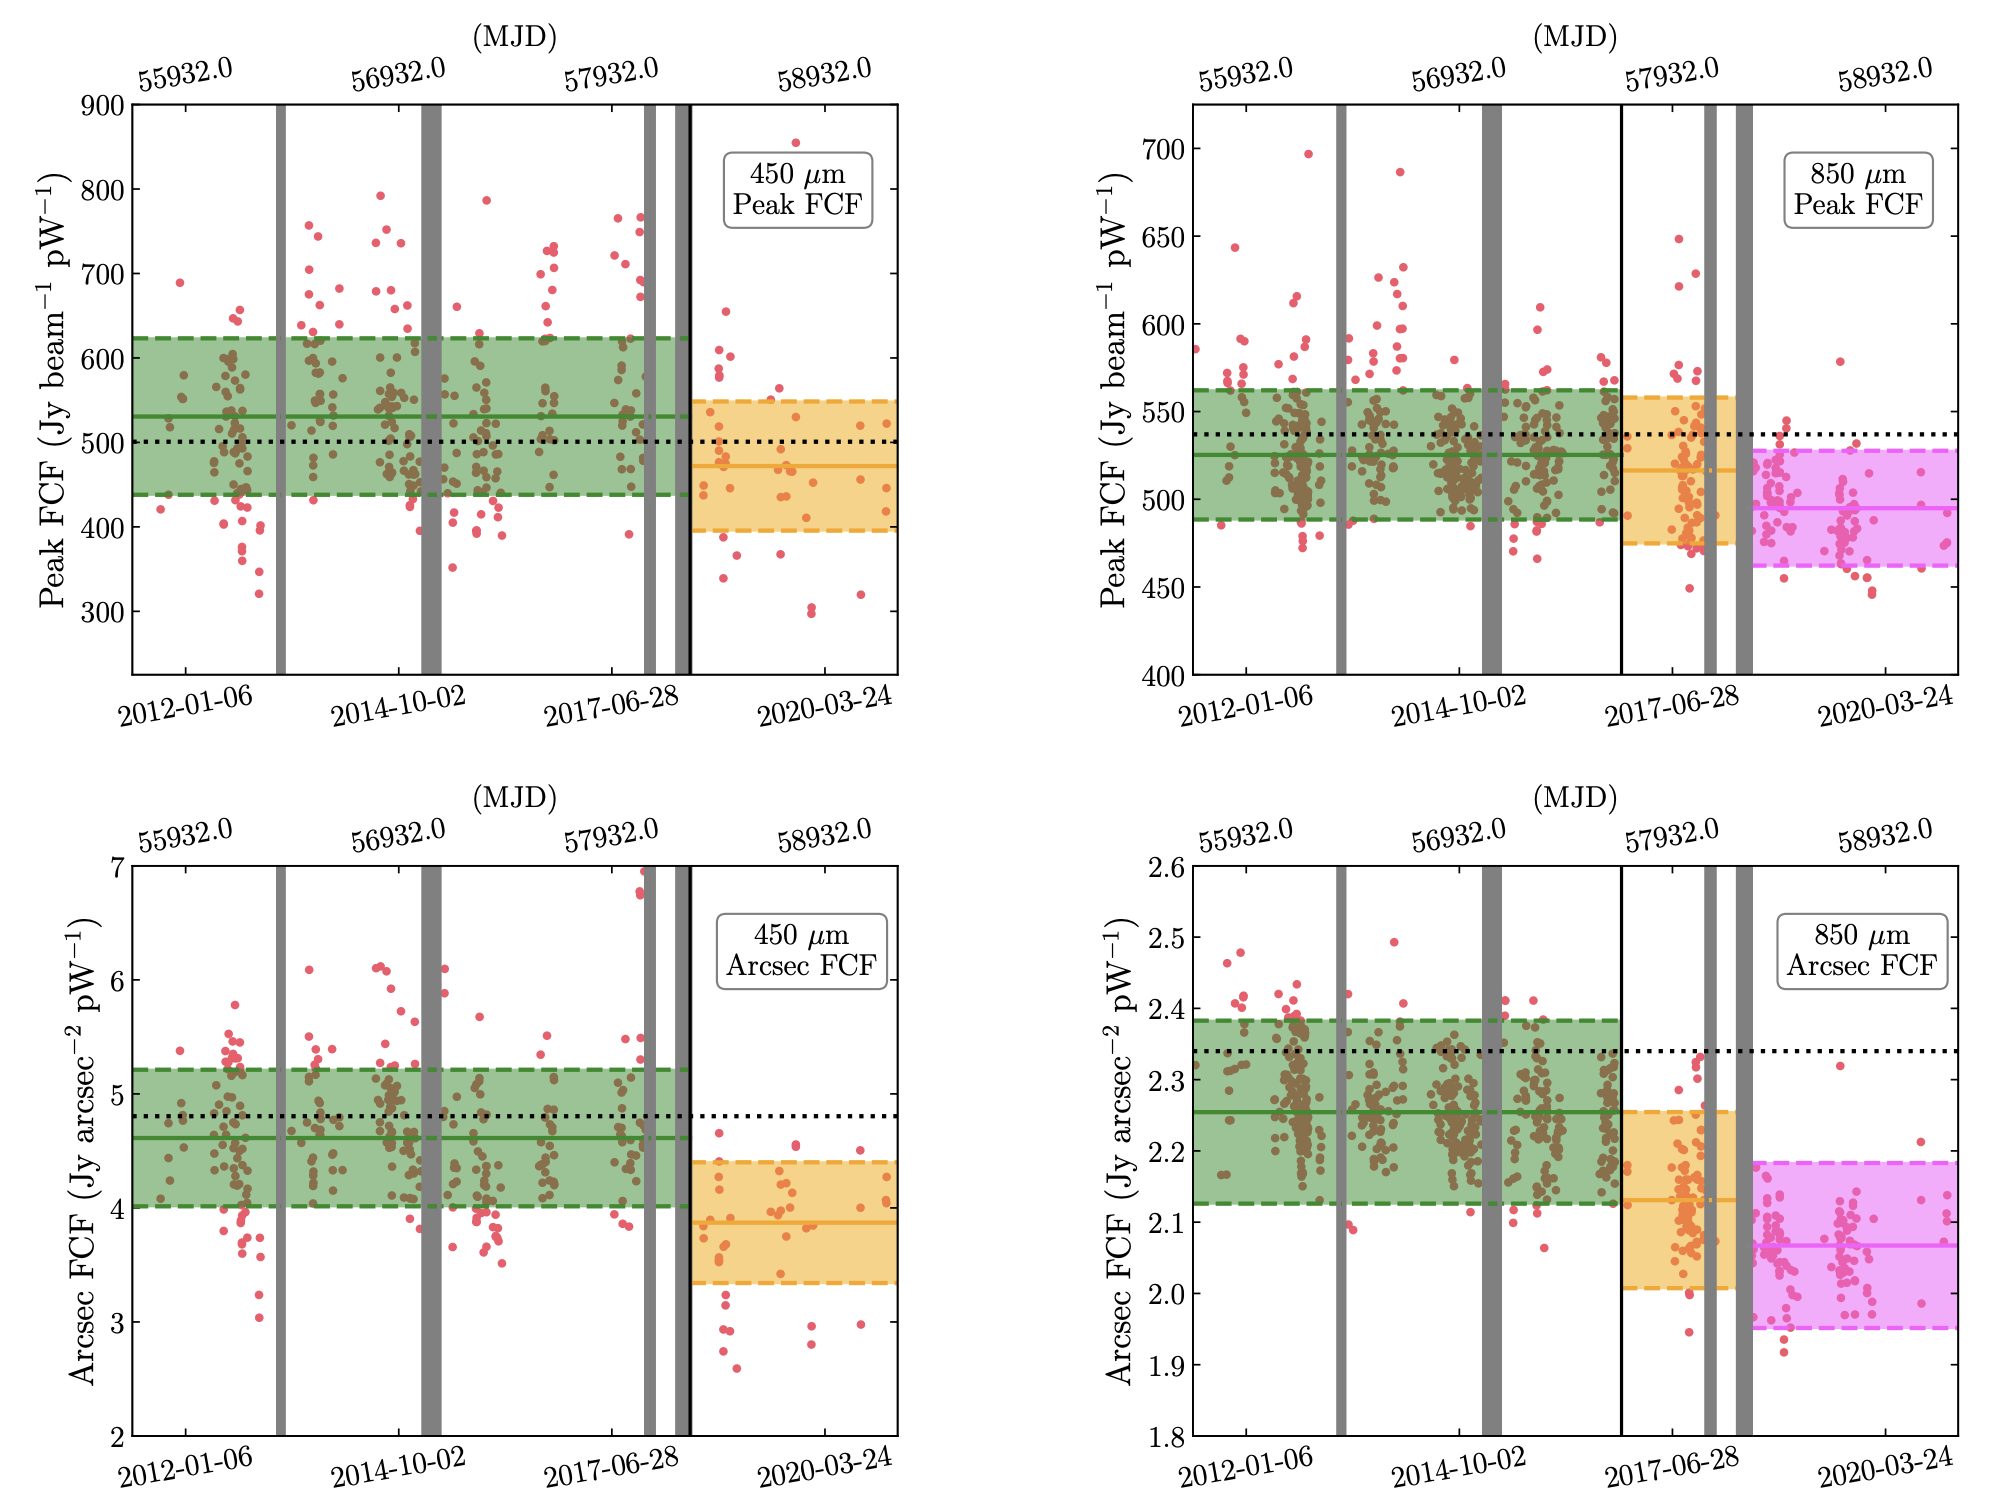
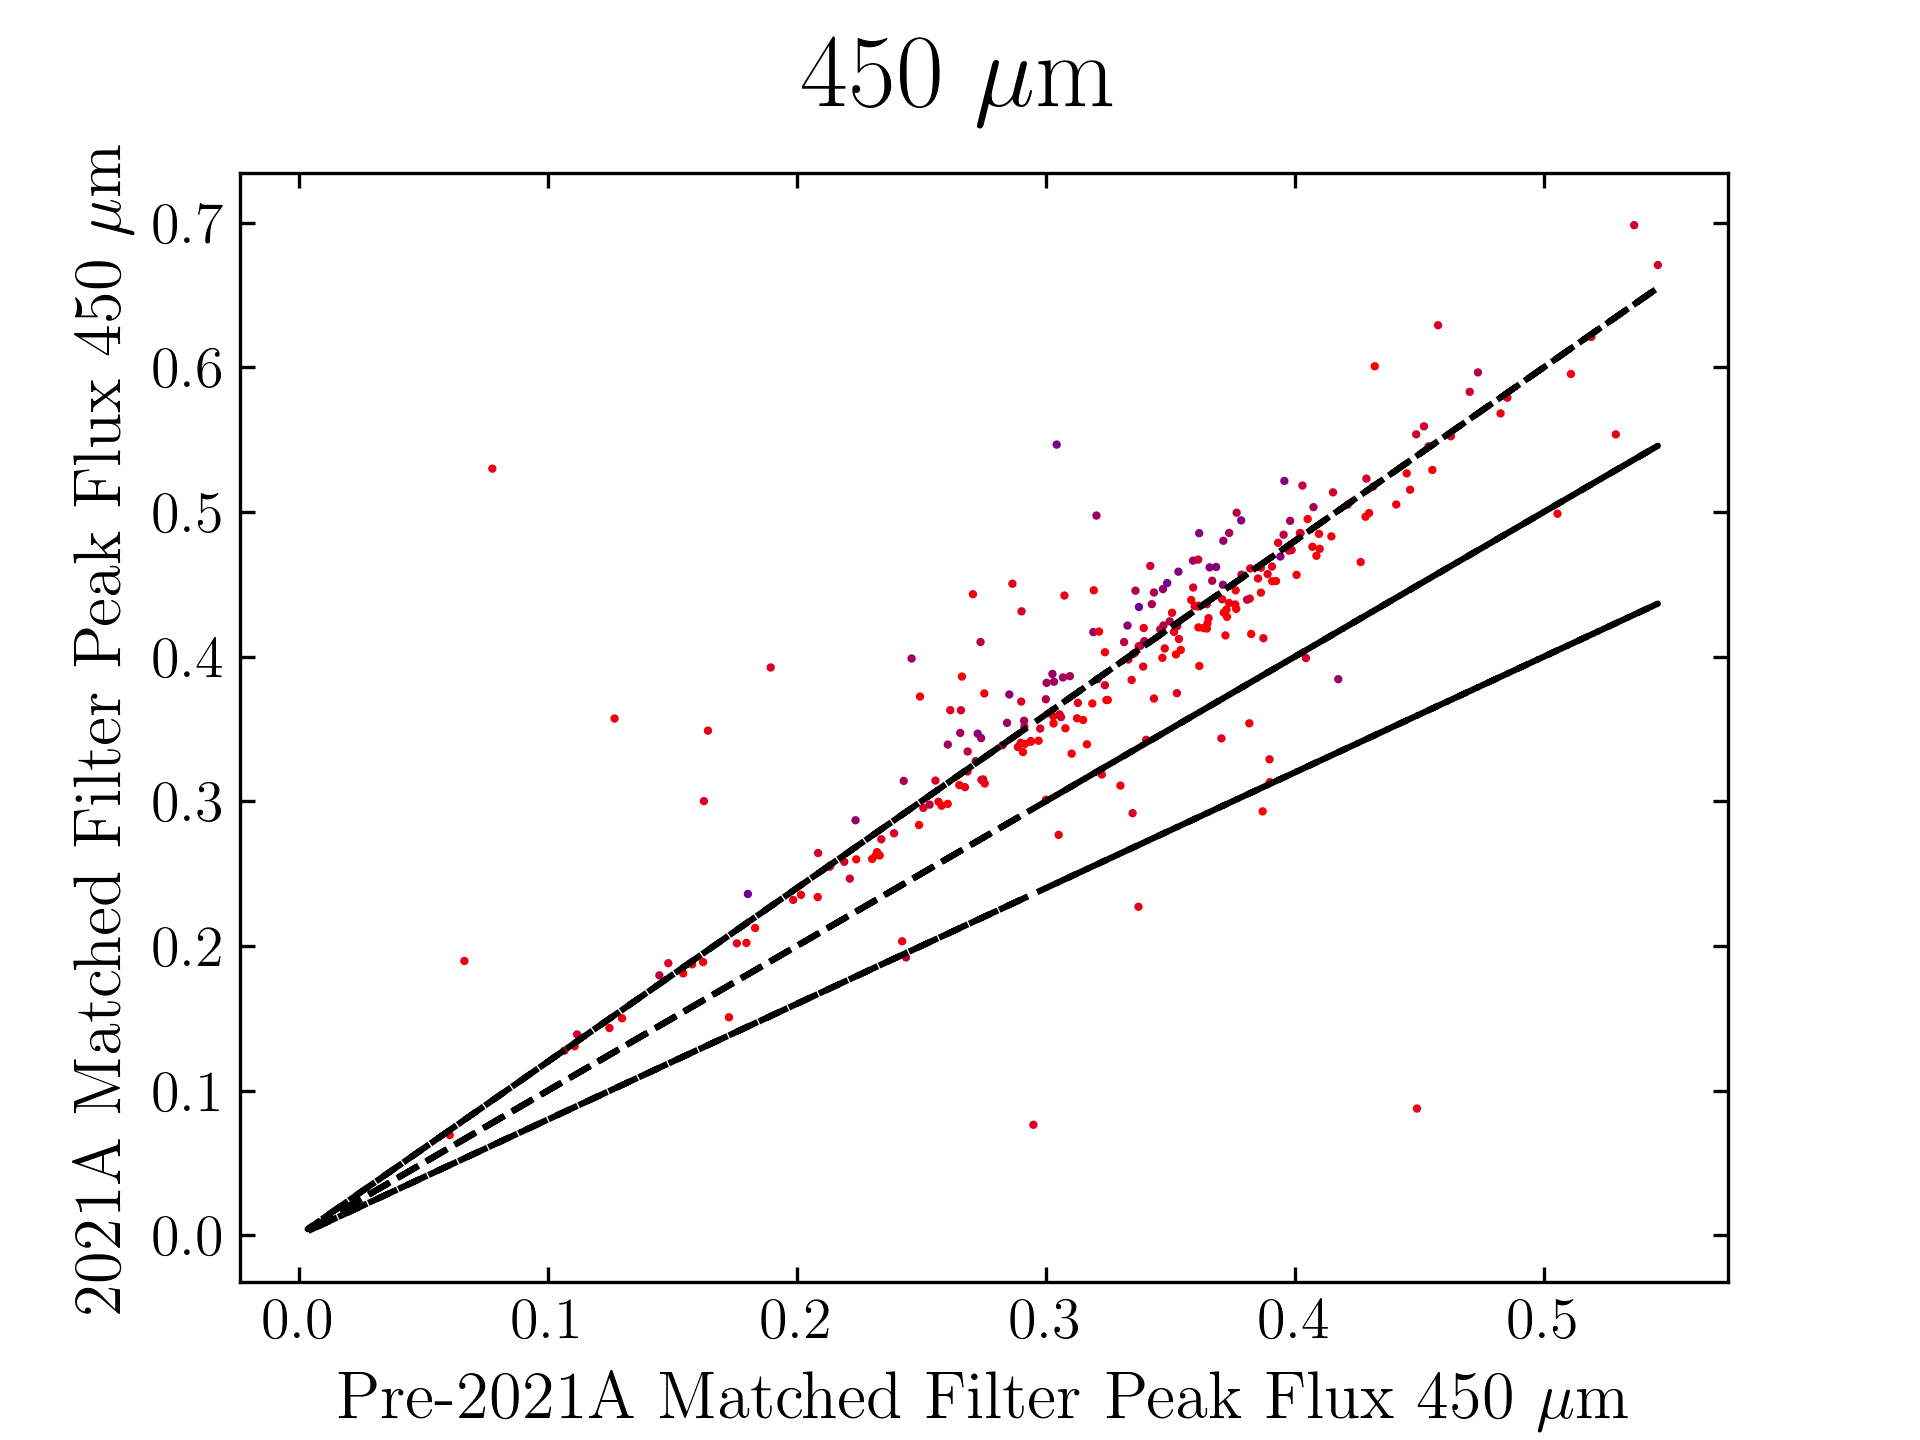
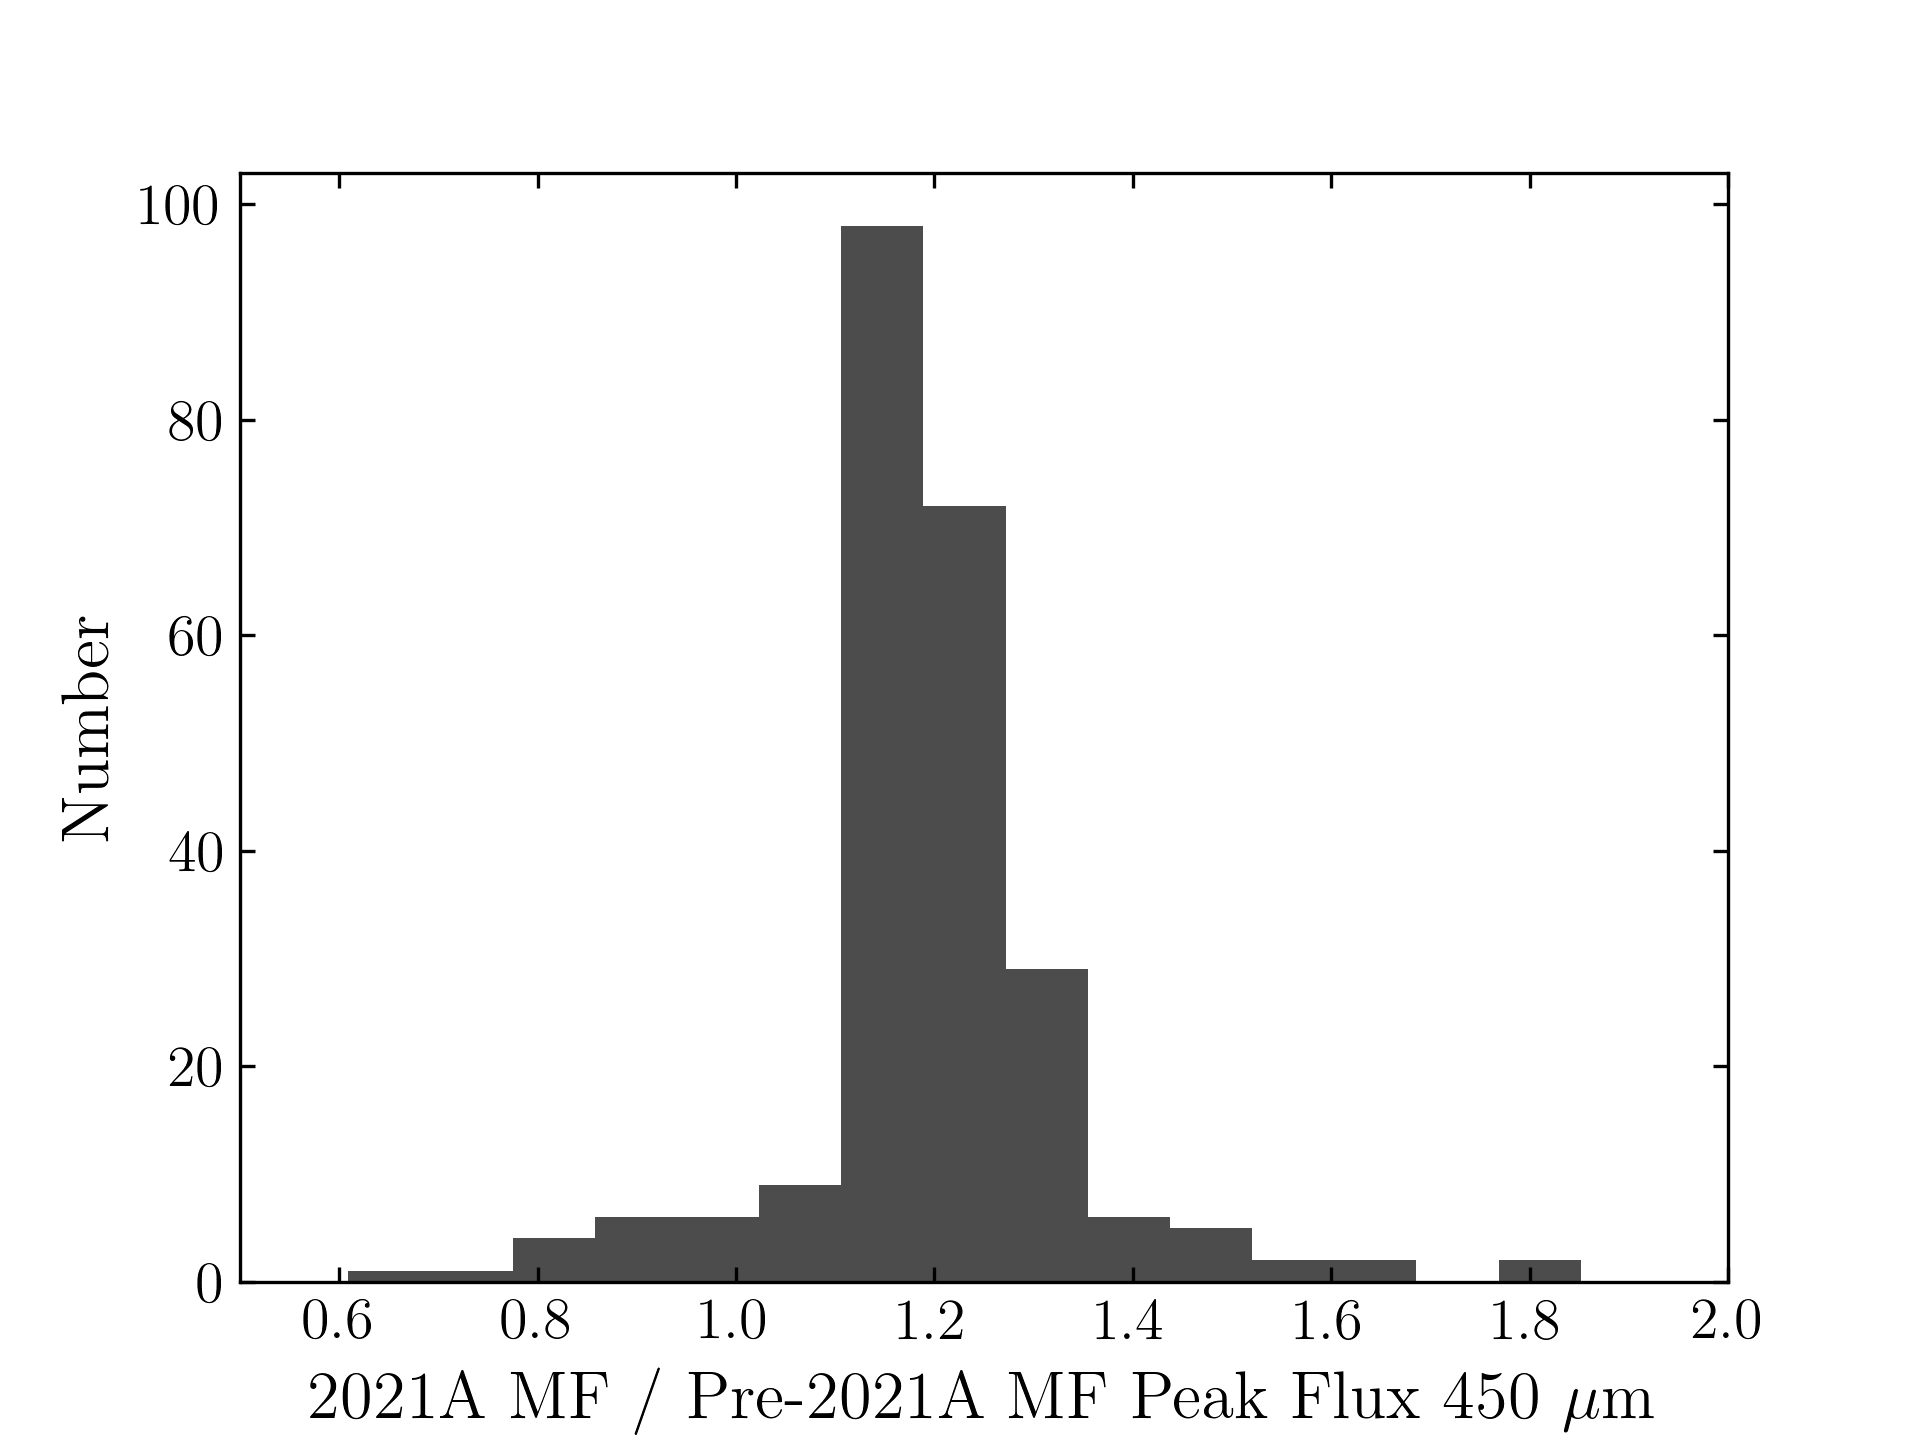
The plots, below, show comparisons between the 2018A Starlink and most recent Stardev matched filter implementation on Uranus calibrator observations taken between 2016-11-01 and 2021-04-13. Note that the Stardev version consistently returns peak flux values that are ~15-20% higher than before due to updated empirical beam measurements presented in Mairs et al 2021.
The beam patterns for matched filtering purposes are described as a combination of two Gaussian functions:
G_total = α*G_mb + β*G_sec,
where each Gaussian profile, G, is of the form exp[−4*ln(2)*(r/θ)^2], where “r” is the radial distance from the centre and θ is the FWHM of the profile, both measured in units of arcseconds. The first component, G_mb represents the “main beam” response. The second component, G_sec, is an approximation of the “secondary beam” or “error beam”, which describes the flux in the shoulders of the profile. α and β are coefficients describing the relative contribution of each component (the amplitudes). The broad error beam includes factors such as sidelobes due to diffraction, static dish deformations, and dish deformations induced by thermal gradients.
450 microns:
850 microns: 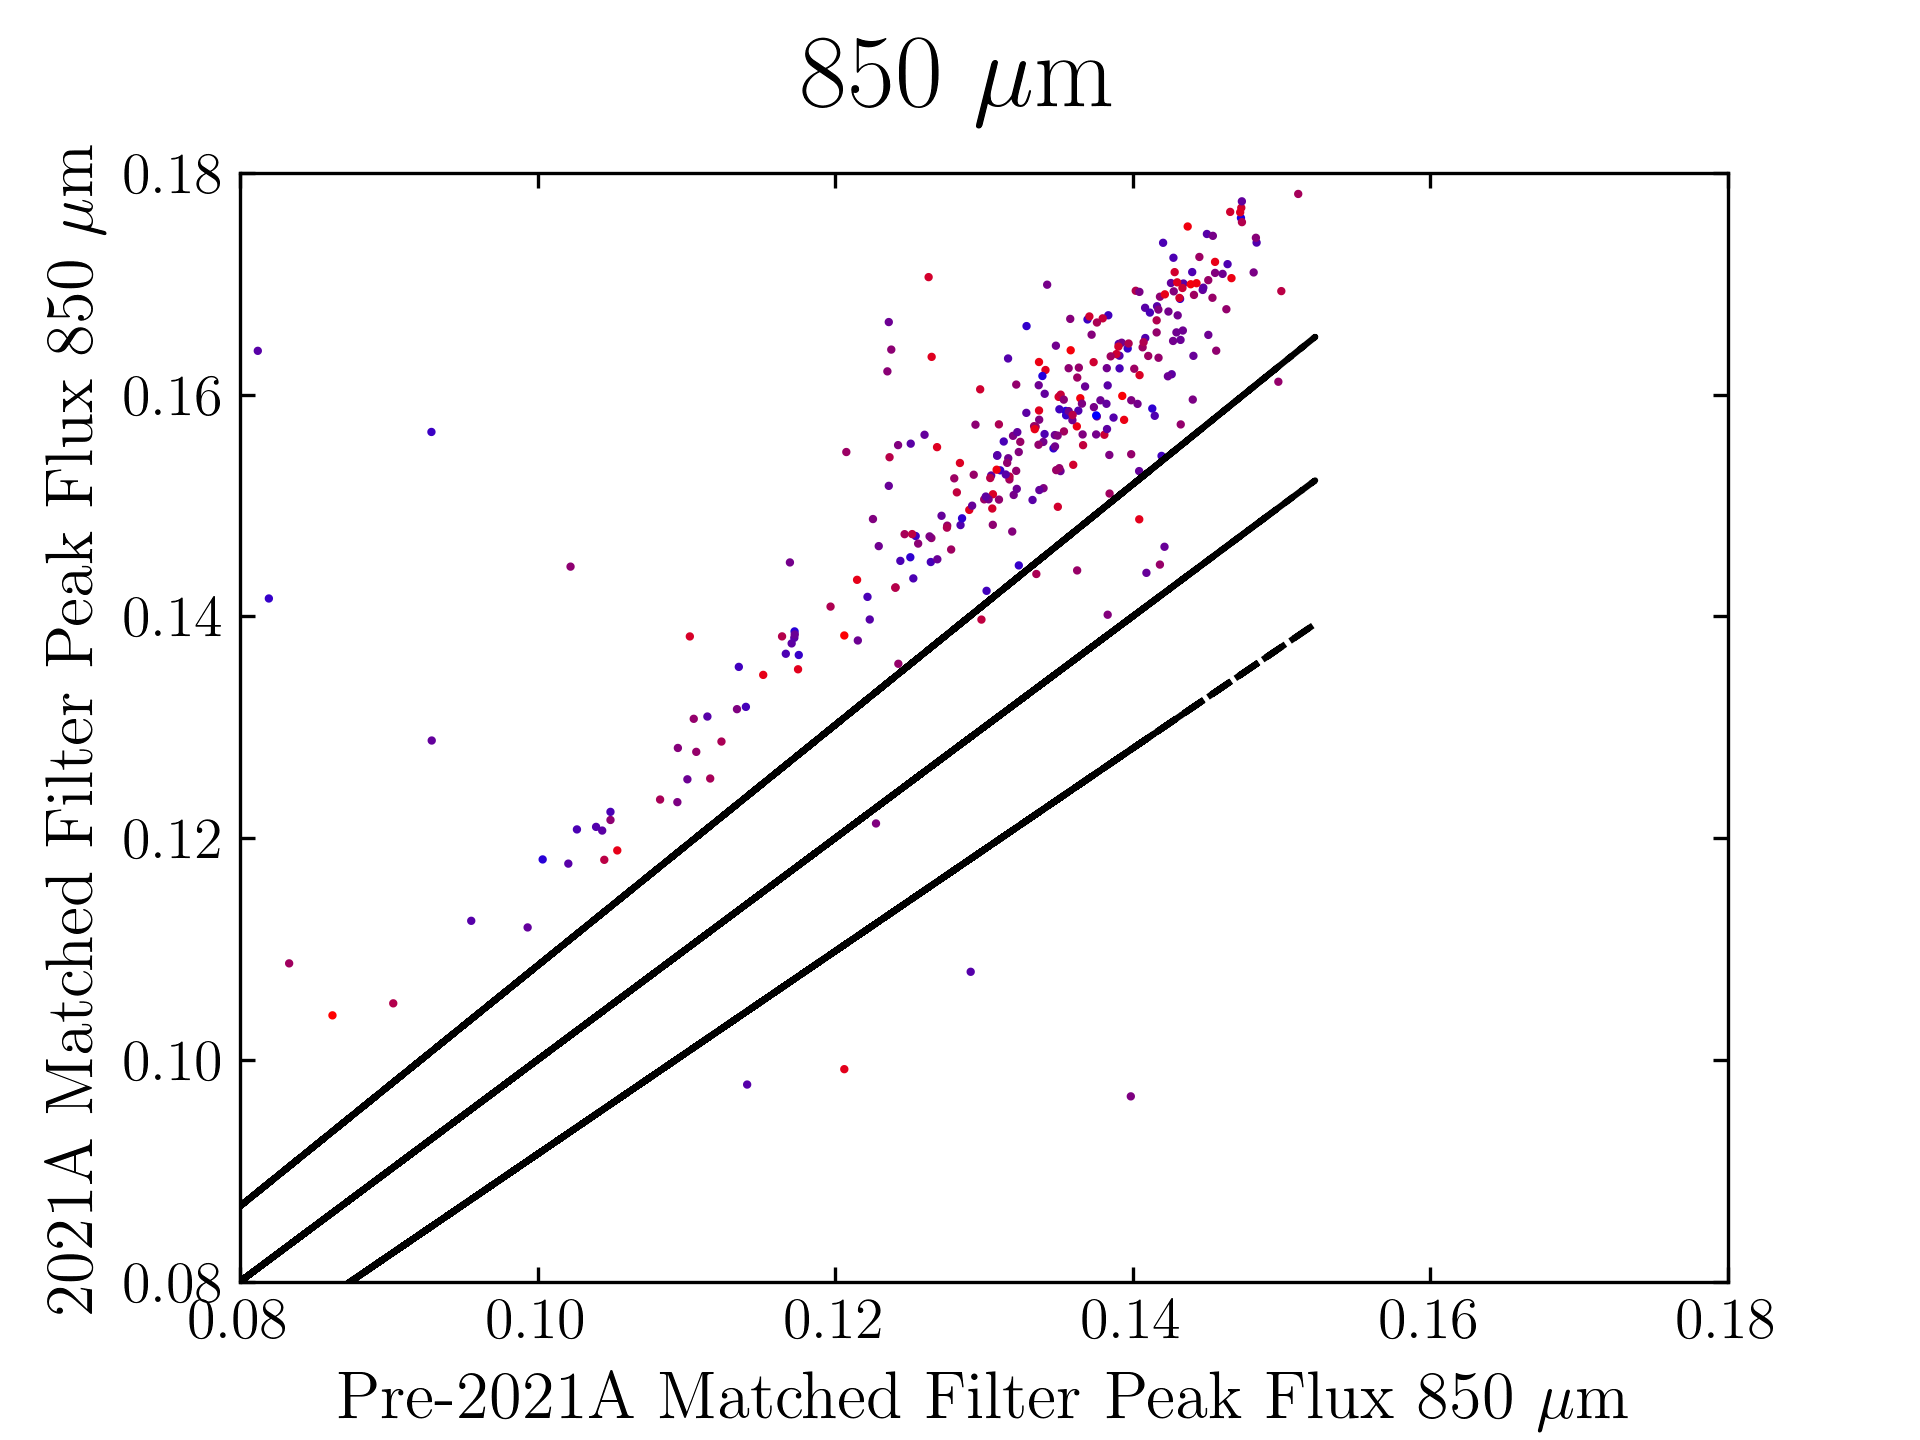
The original SCUBA-2 Beam Parameters were presented by Dempsey et al. 2013:
450 microns:
α = 0.94
β = 0.06
θ_mb = 7.9
θ_sec = 25.0
850 microns:
α = 0.98
β = 0.02
θ_mb = 13.0
θ_sec = 48.0
The updated SCUBA-2 Beam Parameters are presented by Mairs et al 2021:
450 microns:
α = 0.89
β = 0.11
θ_mb = 6.2
θ_sec = 18.8
850 microns:
α = 0.98
β = 0.02
θ_mb = 11.0
θ_sec = 49.1
These values represent the median results after fitting the two-component model to all Uranus calibrator observations since May, 2011 above a significant transmission threshold (see Mairs et al 2021).
The total area of each beam profile, A, can be calculated by:
A = {π/[4*ln(2)]}*[α*(θ_mb)^2+β*(θ_sec)^2].
Comparing the Dempsey et al 2013 beam areas to the Mairs et al 2021 beam areas reveals a ~20% difference at both wavelengths (in practice, there is a spread around this typical 20% value, see plots, above).
Note that previously, it has been common practice in cosmology publications employing “Blank Field” data reduction recipes (e.g. REDUCE_SCAN_FAINT_POINT_SOURCES, REDUCE_SCAN_FAINT_POINT_SOURCES_JACKKNIFE) to apply a correction factor of ~10% in order to compensate for flux lost due to filtering. This 10% factor was derived by inserting a bright Gaussian point source into the raw power versus time stream of individual observations and measuring the response of the model to the filtering during the data reduction process (e.g. Geach et al. 2013, Smail et al. 2014). We recommend repeating this experiment with the new Starlink 2021A matched-filter implementation for your specific data in order to determine whether the correction factor is still necessary.


