


Contents
Introduction
To access JCMT data please go through the JCMT landing page at CADC:
http://www.cadc-ccda.hia-iha.nrc-cnrc.gc.ca/en/jcmt/
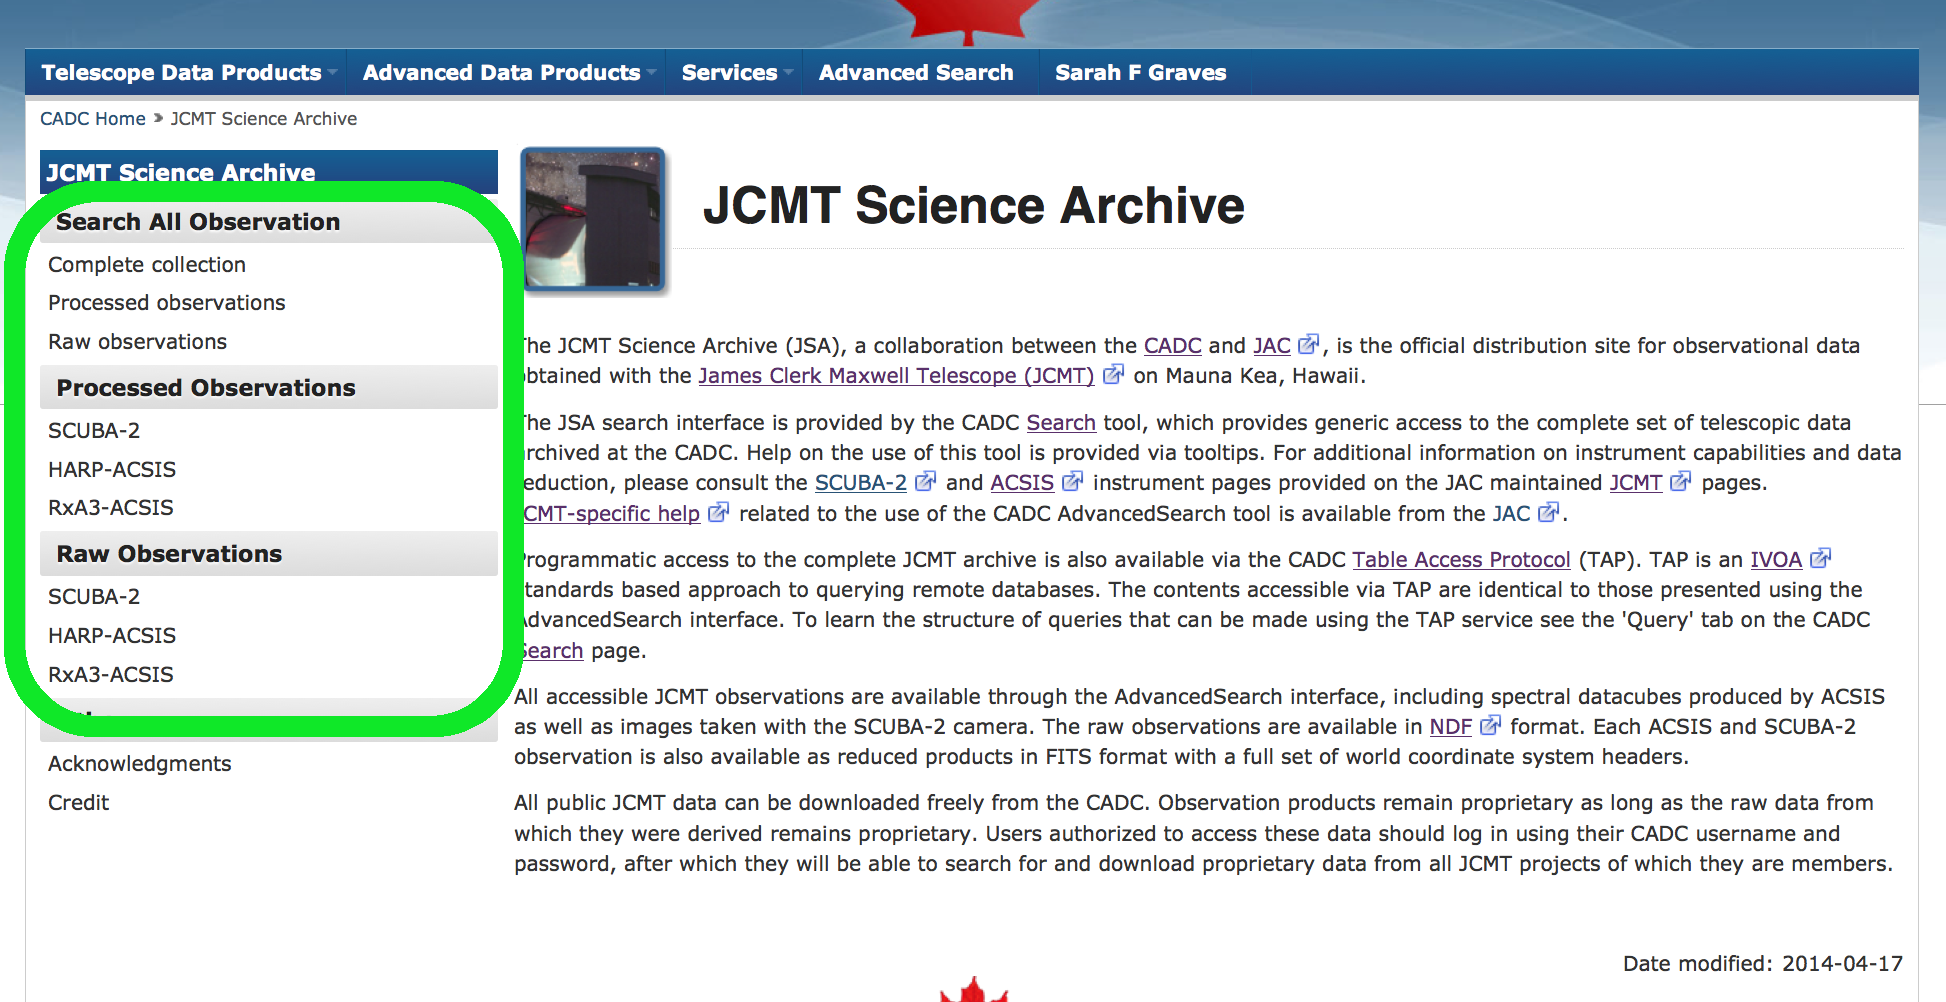
A screenshot of the JCMT landing page at the CADc, with the links to search for different types of results circled.
From here, there are links to search through:
- the complete set of JCMT data.
- raw observations for all instruments.
- processed results for all instruments (i.e. observations and multiple observations reduced with our standard pipeline).
- raw observations from SCUBA-2, HARP-ACSIS or RxA3-ACSIS
- processed observations from SCUBA-2, HARP-ACSIS or RxA3-ACSIS
If you choose to search the full JCMT collection without specifying an instrument on the search page, you will see results from many older instruments. These are not yet fully included in this archive, and are currently missing large amounts of meta data. Searching for observations taken with instruments other than SCUBA-2 or the ACSIS based spectral instruments may produce very incomplete and unexpected results.
All these options will take you to the same CADC main search interface; the only difference is the options that are preselected for you.
- If you reach the search page through one of the specific options (e.g. after clicking on SCUBA-2 processed data), you can easily change all of these selections manually on the search page.
CADC Advanced Search Interface
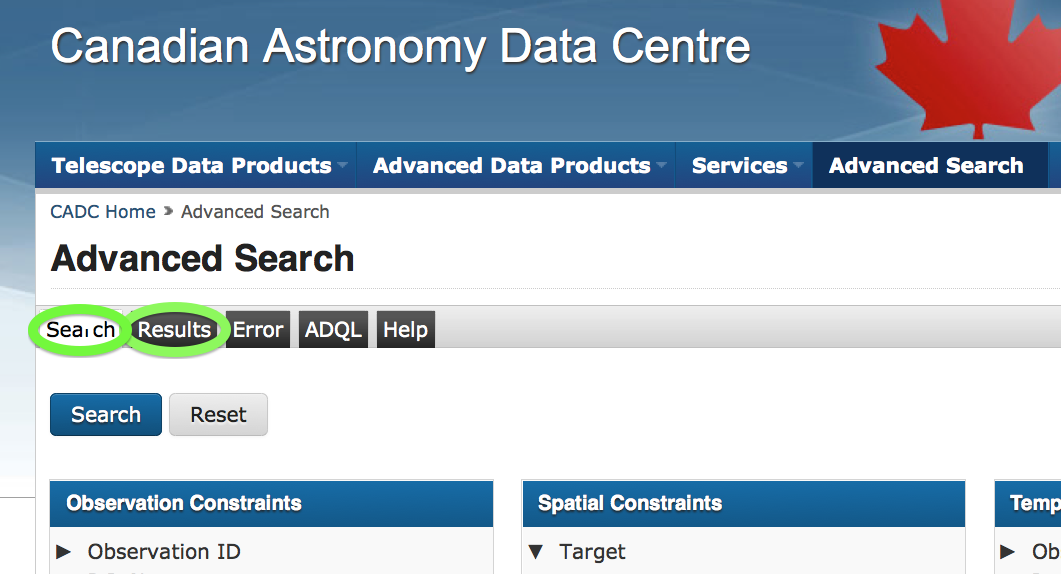
Screen shot of the CADC interface with the Search and Results panes circled.
The two main parts of the interface most users will be interested in are the Search pane and the Results pane. You can move between these by clicking on the tabs at the top of the page, shown in the image above.
The other tabs available are:
- Error Display an error message if something goes wrong.
- ADQL Shows users the ADQL (Astronomy Data Query Language) that defined their current search. This is mainly useful if you wish to use a TAP (Table Access Protocol) interface to query the CADC.
- Help basic help on how to use the interface.
Search Pane
Direct links to documentation for all search criteria:
General hints on searching
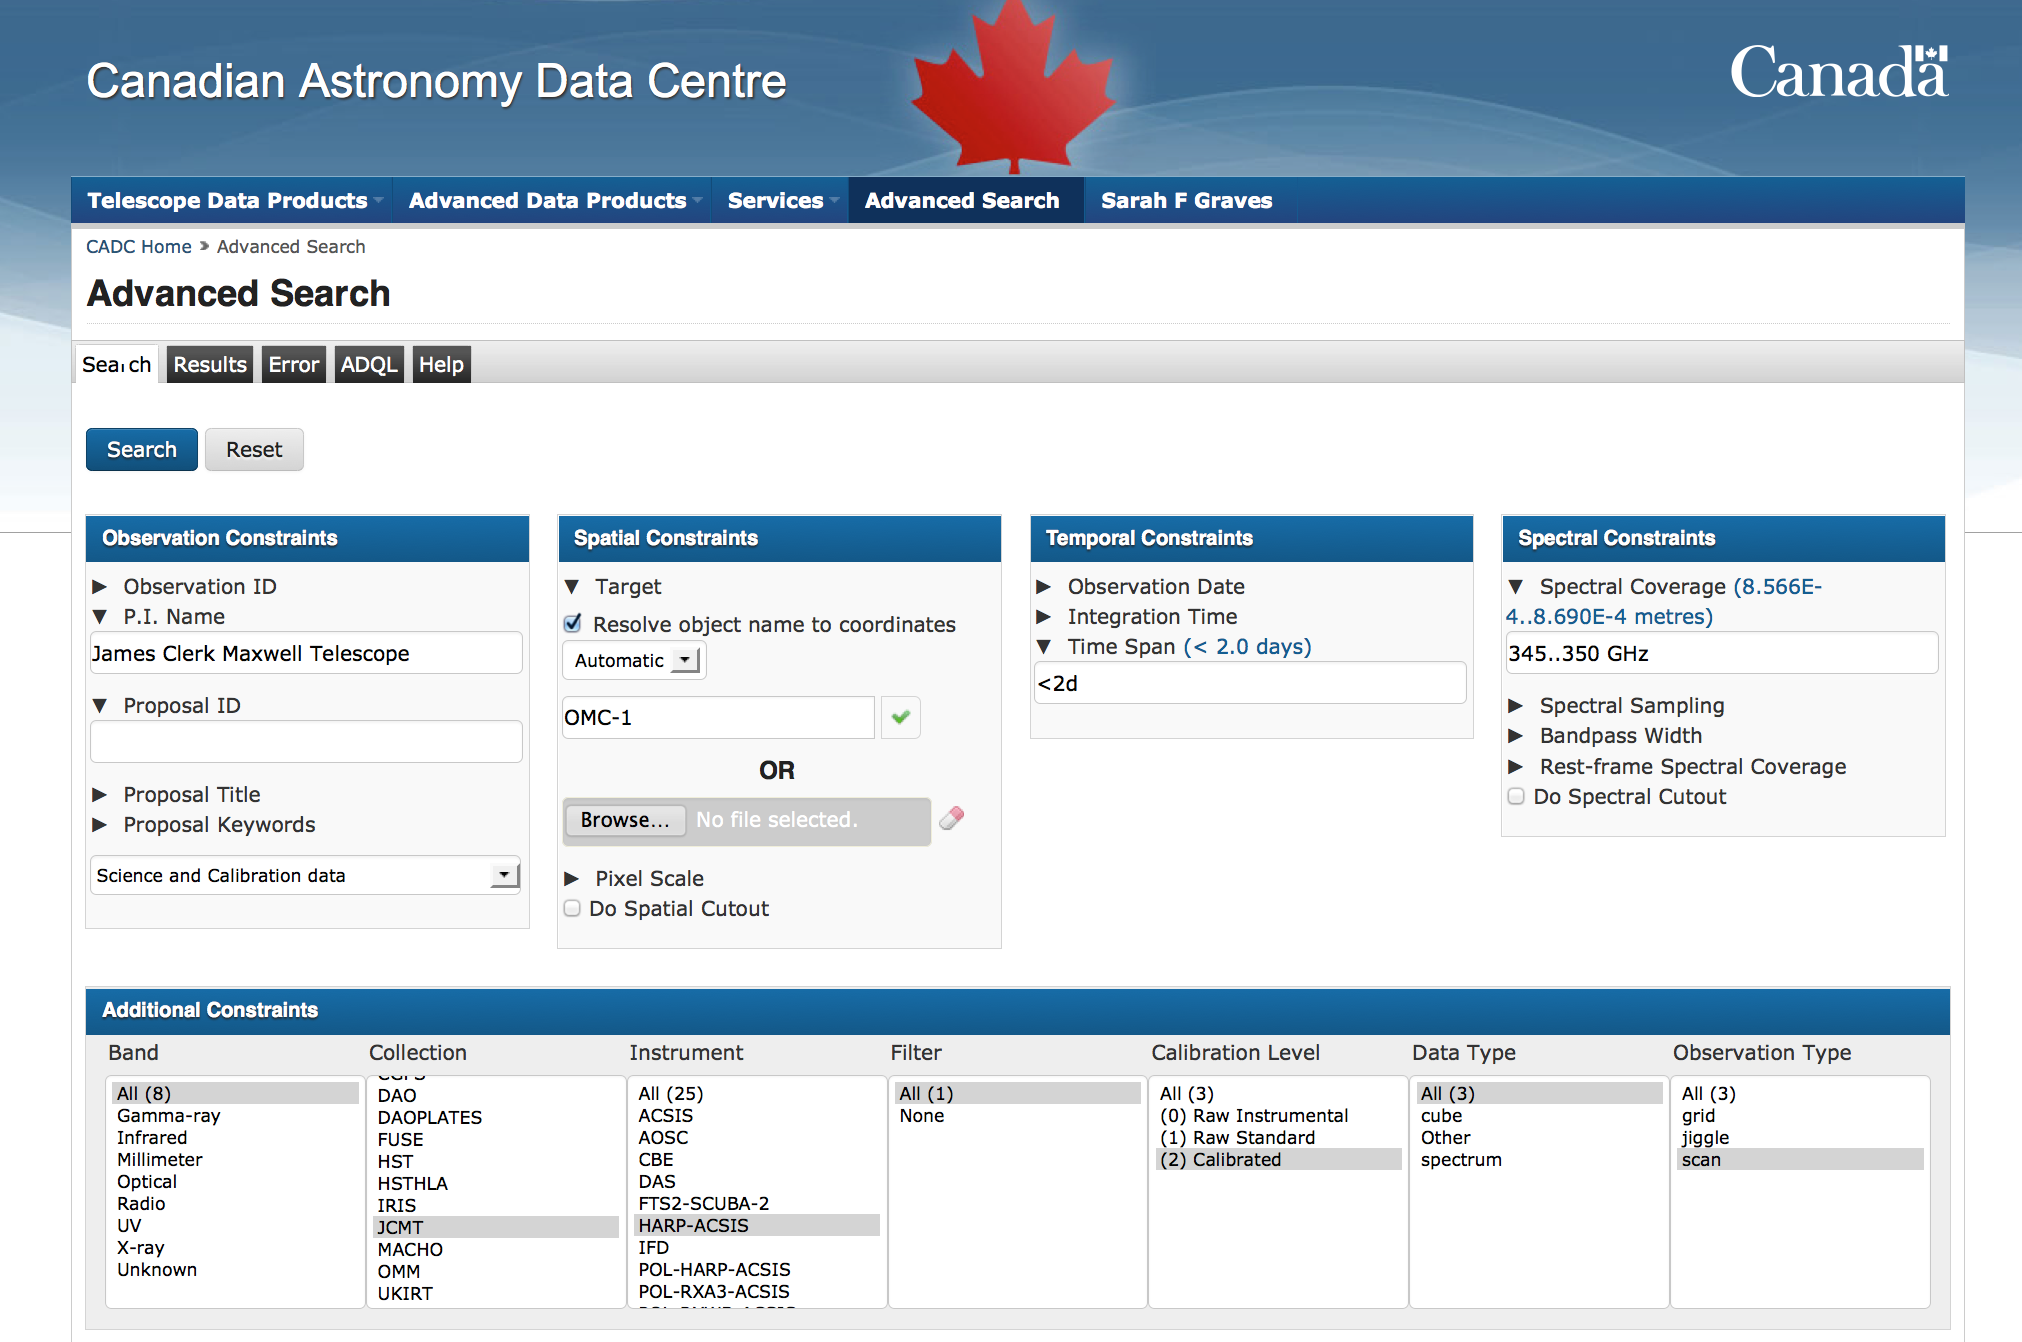
The CADC advanced search page, showing all the search constraints.
The Search pane will let you constrain your results based many different criteria – for example, by proposal, position, date, spectral information, type of observation, level of reduction, calibration or science etc.
A few general pointers for users:
- If you mouse-over a text box, a pop-up help window will appear and show you the format you need to use.
- The results pane can only show you the first 30,000 results that match your search criteria, so it is important not to leave these limitations too wide, even if you intend to filter more thoroughly from the results pane.
- You can use wildcards (*) in the text based searches, and inequalities (< and >) and ranges (..) in the numeric searches.
Observation Constraints
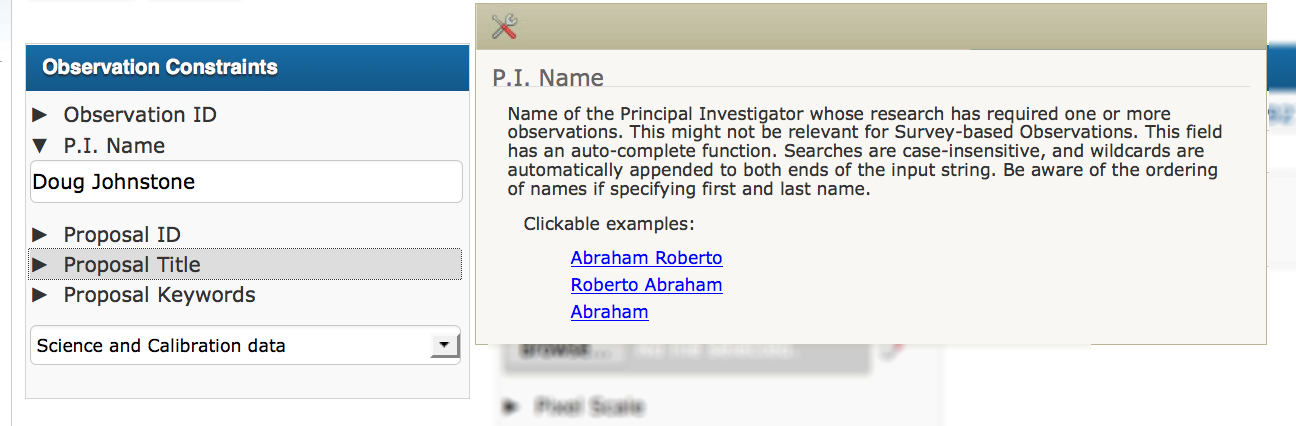
Screen shot of the CADC interface showing the observation constraints page with the pop-up help for one of the text boxes shown.
This set of constraints let you search based on information about the observation or proposal.
- Observation ID.
- For a single JCMT observation, whether raw or reduced, this will take the form: instrument_000XX_YYYYMMDDTHHMMSS, where instrument is either scuba2 or acsis, XX represents the observation number from that night (called sequence number at CADC), and the date stamp is the time at the start of the observation.
- For composite reductions consisting of data from multiple observations co-added or co-reduced, this is a more complex hash, and is not likely to be useful for users.
- Proposal information (PI, Proposal ID or Proposal title)
- When you start typing in any of these boxes, they will present you with a drop-down menu of possible values that match your characters.
- Proposal keywords are not set for any JCMT observations or reductions.
- You can also choose to only view results labelled as science, calibration or both.
Spatial Constraints.
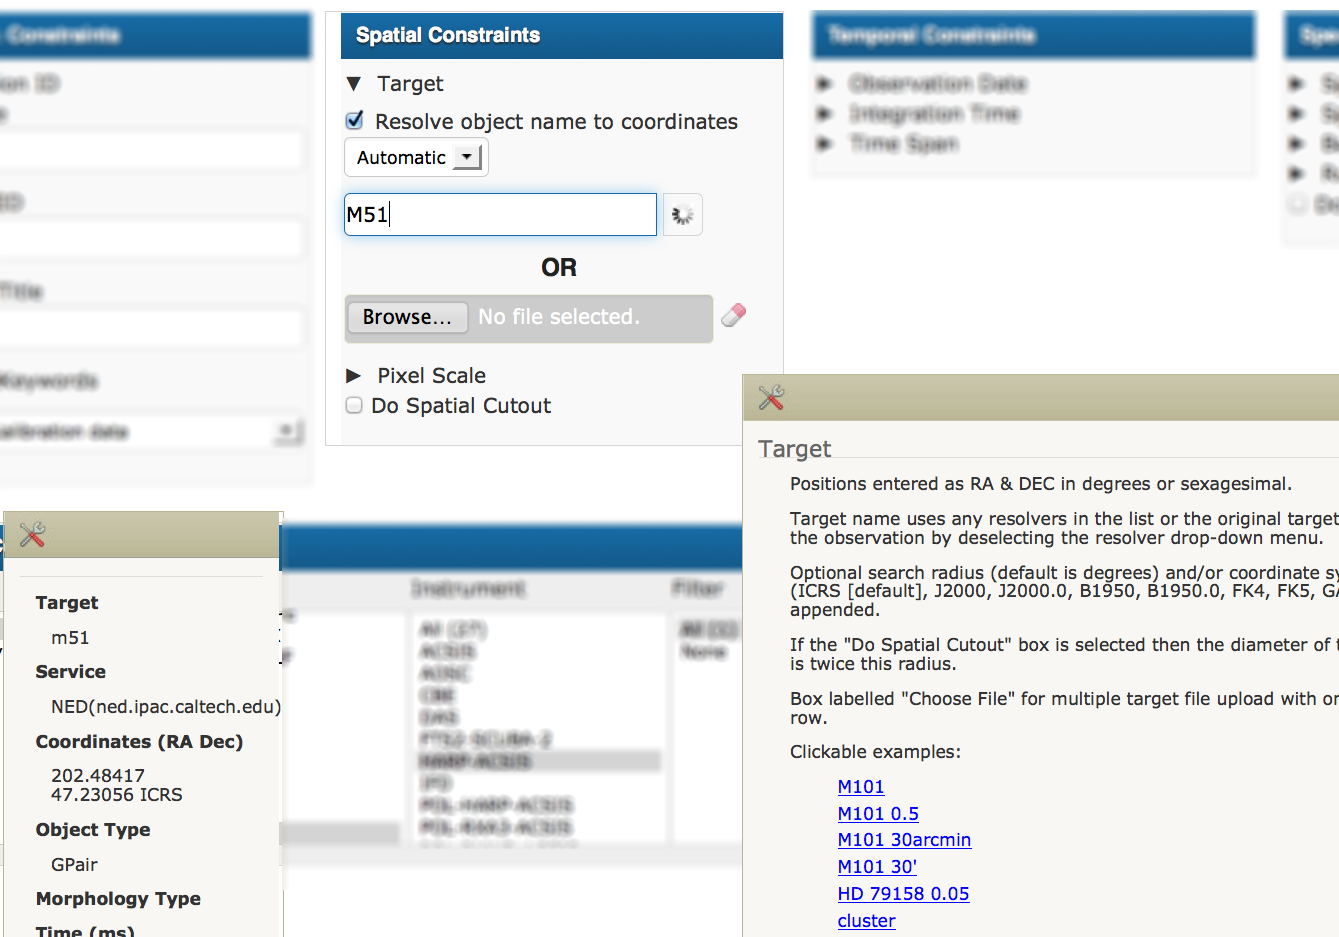
Screen shot of the spatial constraints section of the CADC search page with automatic pop-up help shown. The object name is in the process of being resolved.
-
- Target
-
- Search directly for a position by typing in the coordinates and optionally a radius.
- Resolve a standard target name to coordinates (uses SIMBAD, NED or VIZIER). A green tick next to the target box indicates it has successfully resolved the name; a red cross means it has not. A radius can still be added to this type of query.
- The coordinates used will be shown in a pop-up window, and also on the result page.
- Search directly for the target name as set by the observer, by unchecking the “Resolve object name to coordinates”.
- This is currently the only way to search for Moving Objects, such as planets (usually telescope calibrations and therefore have the appropriate name) or comets etc. (have the name set by the PI for their observation).
-
- Pixel Scale
-
- Constrain your search to only return data of a specified pixel scales. This should be used with caution for JCMT data as our raw observations do not have this value set. For reduced data, the pixel scale is dependent on the reduction settings that were used for that file.
-
- Do Spatial cutout
-
- If you set this, then any cube or map you download will be trimmed to only show you the region of the result that overlaps with your set target position and radius.
Temporal constraints
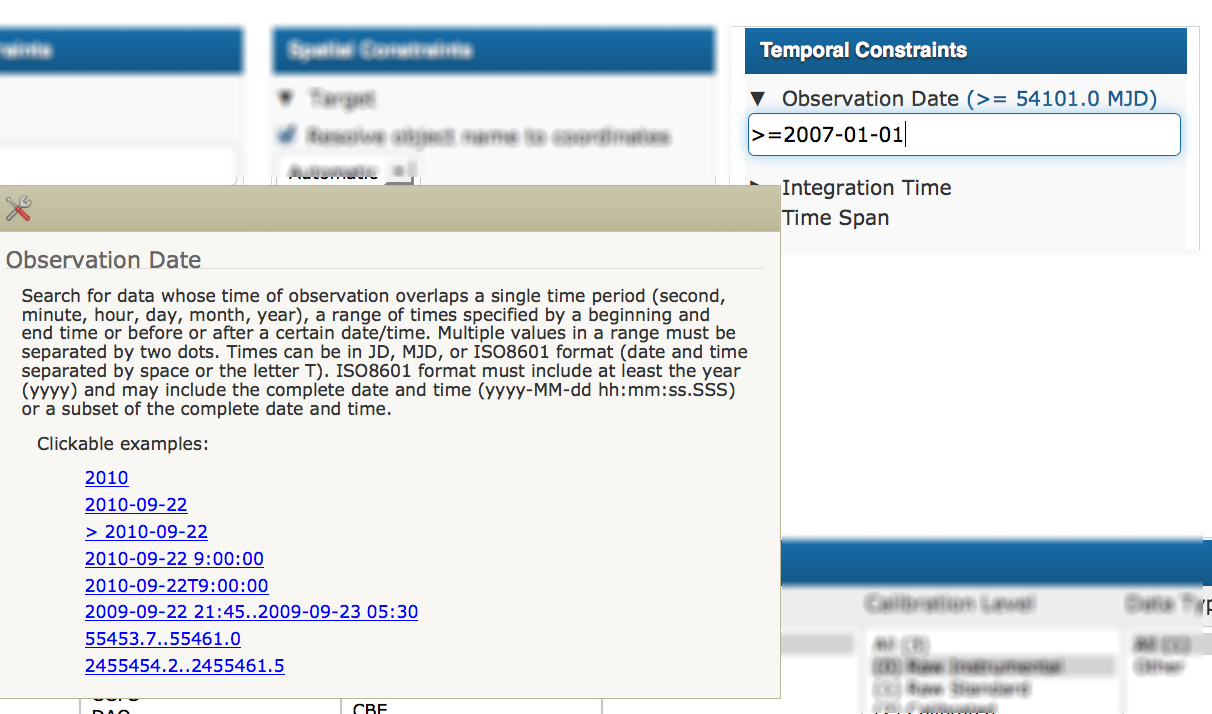
Screen shot of the temporal constraints section of the CADC search page with automatic pop-up help shown.
-
- Observation date
-
- if you use the range indicator .., but do not specify the full date and time, it will consider the date to be the earliest date-time that could be specified by what you gave
- For example, if you search for 2007-06-01..2007-06-30, you will not see observations from the 30th of June 2007, as it will consider 2007-06-30 to represent 2007-06-30 0:0:0.0
- Composite reductions including data from multiple observations will be returned if the date or range specified falls within the start time of the first observation included and the end time of the last observation included.
-
- Integration time
-
- For results that are a single observation, this searches for observations where the total time the observation took (between start and end time) matches your criteria.
- For results representing composite reductions, this is the sum of the time spent by each observation.
-
- Time span
-
- Find only results whose start and end time match your chosen time span. For composite reductions of multiple observations, this is the time difference between the beginning of the first observation and the end of the last observation.
- Although the JCMT does not currently have many composite reductions that span more than one night, the ones that are present can span multiple years. To remove these results, please set the Time span constraint to an appropriate value, such as <2d.
Spectral constraints
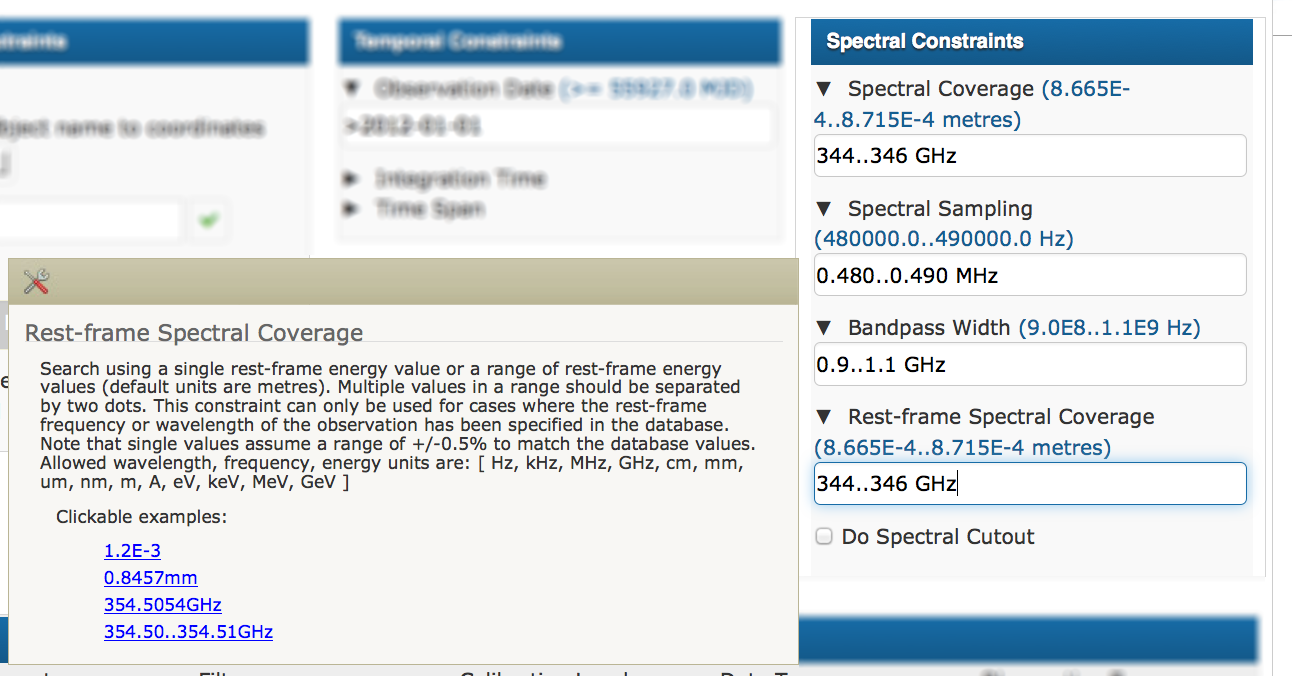
Screen shot of the spectral constraints section of the CADC search page with automatic pop-up help shown.
This section allows you to constrain your results based on various sets of spectral information. You can use frequency, wavelength or energy based units. You cannot use km/s however, or enter a molecular transition.
-
- Spectral coverage
-
- Only search for observations or reductions whose start and end wavelength overlaps with the range you insert here. E.g., to search for both HARP or SCUBA-2 850um observations, but not SCUBA-2 450um observations, you could set the range here to be 300..400 GHz.
-
- Spectral sampling
-
- This searches the channel width. The default widths for ACSIS observations in MHz can be found here.
-
- Bandpass width
-
- Searches for observations/reductions where the difference between the beginning and end frequency or wavelength match this constraint.
-
- Rest-frame spectral coverage
-
- This searches for observations whose rest frequency matches this constraint.
- Note that observers who were looking for observations with a large velocity shift will sometimes enter the observed frequency manually rather than use the local velocity of their source and a standard transition.
- This searches for observations whose rest frequency matches this constraint.
-
- Do spectral cutout.
-
- If you check this box, then any cubes you download will be limited to the frequency/wavelength range you set in the spectral coverage box.
Additional constraints
This section lets you constrain your results based on a variety of miscellaneous attributes, many of them using telescope specific terms.
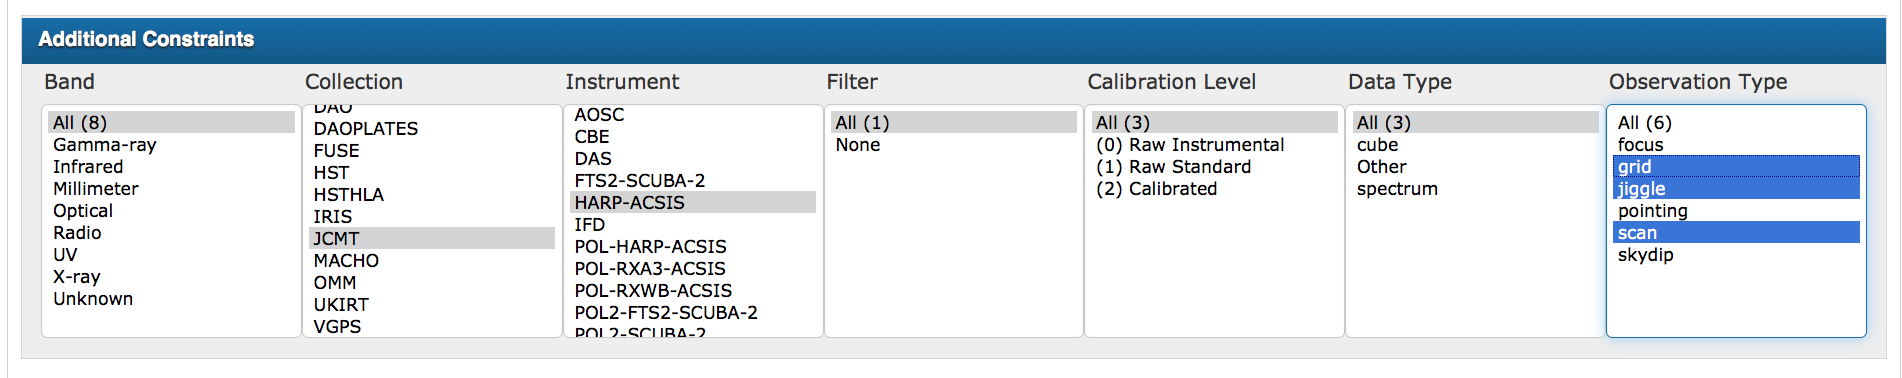
Screen shot of the additional constraints section of the search pane. This search is looking for only JCMT results using HARP-ACSIS, all calibration levels and only looking for observations in modes grid, jiggle and scan
-
- Band
-
- The wave band of the observations. All JCMT data should be labelled as Millimeter. Currently, a few observations that have been incorrectly ingested may show up as unknown.
-
- Collection
-
- All JCMT data is currently listed as collection=JCMT. In the future, we may use additional JCMT collections to distinguish PI produced results that are being made available to the community.
-
- Instrument
-
- Only SCUBA-2, HARP-ACSIS and RXA3-ACSIS have been fully incorporated into this interface so far. Observations taken with older instrumentation may have a lot of gaps in their metadata, and may not be easily searchable. In the future, we hope to improve this.
-
- Filter
-
- For SCUBA-2 results, this will be either SCUBA-2-450um or SCUBA-2-850um
- It is not set for ACSIS results
-
- Calibration level
-
- For sub/millimeter users, this can be thought of more as the reduction level as opposed to the calibration level.
- 0 represents raw, unreduced instrumental data in Starlink ndf format.
- 1 represents ACSIS data that has been gridded onto a position-position-velocity cube, but has not been reduced at all.
- 2 represents data that has been reduced using our standard ORAC-DR pipelines. Particularly for HARP-ACSIS data, this has been much improved since the start of operations, and the quality of recently reduced data will be far better than for older reductions.
- Calibration level = 2 will return both individual reduced observations and also composite reductions of multiple observations.
-
- Data Type
-
- For JCMT users this should be fairly self explanatory; you can choose to return only results that are cube (3-D position-position-velocity cube), spectrum (individual spectrum), image (2-D maps for continuum observations) or Other (raw data, which actually doesn’t set this field).
-
- Observation type
-
- This lists the observation mode; most should look familiar to JCMT users.
- For SCUBA-2, daisies and pongs are both listed as scan.
- For ACSIS, raster maps are listed as scan.
- This lists the observation mode; most should look familiar to JCMT users.
Results Pane
Table of contents for this section:
General hints on using the results pane
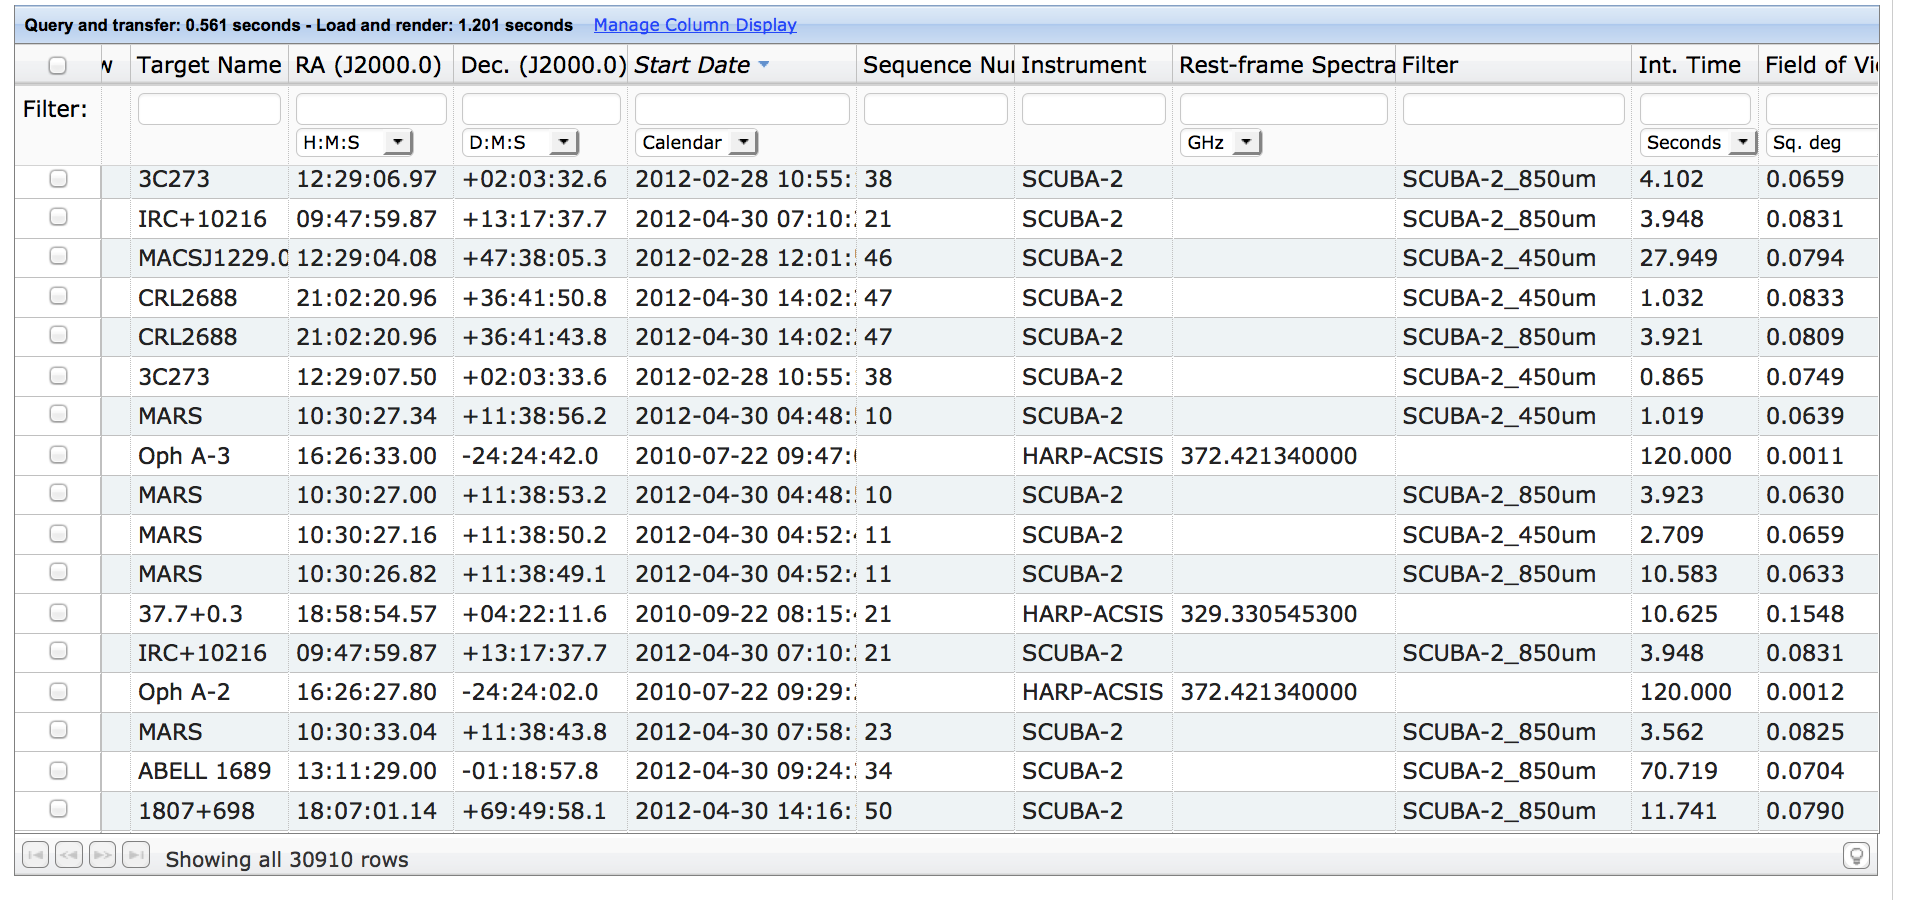
A screen shot of the CADC results pane, showing results for both SCUBA-2 and HARP-ACSIS. There are more columns that cannot be seen without scrolling to the right.
On the Results pane you will see a separate line for each object in the CADC database that met your search criteria. Each line may represent a single observation or a composite reduction of multiple observations.
You can refine these results by filtering them based on the displayed values, and select which displayed results to download by clicking in the far left hand column (labelled filter).
If the only telescope data collection you are searching is the JCMT, then the results will use our default column preferences. We have chosen these columns to allow most users to identify the returned objects without overwhelming the display with unnecessary information.
You can drag the column title boxes around to adjust the column order and the column widths. To view the full list of available columns and change which ones are displayed, click or hover over the Manage column display link on the results pane. This will show you the full list of available columns; please see Full list of columns for more information on their meaning.
- The Manage column display pop-up help window is very long, and doesn’t use a scroll bar. If you don’t have scroll wheel or scroll within a trackpad functionality, you should still be able to access the bottom of the list by using the up and down arrow keys.
Data Quality
It’s useful for users to note that some manual quality control is applied to JCMT observations. Non-astronomical observations (e.g. observations of the dome taken during instrumental commissioning) should have been flagged by the JAC and should not be visible through CADC’s search. Observations that appear to show strong instrumental affects should be labelled as bad or questionable at the JCMT: these are visible through this interface, but are not included in composite night reductions. These observations will have a flag of ‘FAIL’ shown in the Quality column at CADC. Other observations should be labelled as good at the JCMT, and these are included in the composite reductions. These good observations will have a blank entry in the Quality column in the CADC results page. Details of why an observation has been labelled as FAIL (i.e. as BAD or QUESTIONABLE) is not shown at CADC, but can be found on the JCMT telescope observation logs for a given night.
In addition, there is automated QA included within our data reduction pipelines. This will not include observations or sections of observations within a reduction if they are judged to be of poor quality. For more information, please see the ACSIS DR Cookbook or the SMURF SCUBA-2 Data Analysis Cookbook.
Columns
The standard JCMT columns are (in their default order):
- Filter This is a special column, which will always appear on the far left of your currently visible columns, regardless of where you scroll to. Clicking on within this column will select or unselect that row to be downloaded. When you click on the download button above the results table, you will only download objects that are selected in this column.
- Preview Image [Currently being implemented for JCMT] This will show the pipeline-produced representative image and/or spectrum for the reduced object. The image will be visible as a transient pop-up window if you hover over the link, or if you click the link it will open in a new window.
- Target Name As set by the original observers in their observing project.
- RA (J2000) and Dec (J2000) These should represent the rough centre of the observed region or of the reduced map/cube.
- Proposal ID The JCMT assigned project code, e.g. M14BU01
- Quality This is blank if the observation is labelled as GOOD within the JCMT’s OMP system, or will say Fail if the observation was marked as either BAD or QUESTIONABLE in the OMP. Observations marked as JUNK in the OMP are not shown through the Advanced Search interface.
- Start Date UT start date and time of observation, or of first observation included in the co-add/co-reduction.
- Sequence Number The scan number of the individual observation at the JCMT.
- Instrument Name Instrument name, e.g. SCUBA-2 or HARP-ACSIS.
- Rest frame spectral coverage [GHz]. The rest frequency of the observation.
- Filter 450 um or 850 um filter (continuum only)
- Molecule Molecule (or ion) being observed for spectral observations, as set (or not) by original observers.
- Transition Molecular Transition being observed for spectral observations, as set (or not) by original observers.
- Integration time Raw observation: this is the total integration time for observation. Reduced files: this is the average integration time per spatial pixel in the reduced map or cube.
- Field of View Spatial area of observation (in square degrees by default).
- Instrument Keywords Additional information about instrumental setup. Includes e.g. pong or daisy mode for SCUBA-2 observations; the chop mode and the sideband for ACSIS observations.
- Obs Type Type of observation, e.g. pointing, setup, scan, jiggle or focus. For SCUBA-2, both daisies and pongs are listed as scan.
- Intent Science or Calibration. Usually set by the observer of the data, but SCUBA-2 pointings have been labelled Science as they produce a map. Focus, setup, spectral pointings and noise observations are all labelled as Calibration.
- Time Dependent Should indicate whether an object is a moving object such as a planet or a comet. Not currently functional.
- Algorithm Name How observations were grouped together (see below for a fuller understanding of this column).
- Product ID This is an identifier for the type of result – i.e., is the product raw or reduced and which waveband/frequency is it. It also includes the bandwidth mode for ACSIS observations.
- Data Type This can be either image, cube or spectrum. It is not set for raw data.
- Collection Currently all JCMT products are labelled as JCMT. In the future PI or legacy survey produced products may be in separate collections.
Identifying an observation or composite observation
The JCMT produces a large number of different types of results that will be shown here. Depending on your search criteria, these will include:
- Raw individual observations, as instrumental time-series files in Starlink NDF format (.sdf).
- Individual observations, gridded into maps or cubes by the pipeline, and in FITS format (.fits).
- Composite ‘night’ reductions: co-adds/co-reductions of all the repeats of a given observation on a single night (also in FITS format).
To distinguish between these different types of observations, you can use the enigmatically named algorithm name column and the product ID column. The algorithm name identifies which observations were added together to produce the output file, and can be any of:
- exposure a single observation, whether reduced or not.
- night all repeats of a specific observation taken on a single night (always reduced data). All observations that have not failed QA should be present in a night reduction.
- project co-add or co-reduction of all the data from that project that fell in the same spatial and spectral region (reduced). Only a few examples of project reductions are present in the database.
The product ID column identifies if the data are raw, raw-standard or reduced. These data types correspond to the numerical Calibration Level which can be applied as a search constraint; this Cal. Level column is available in the results page through the Manage Column display link in the results pane.
- RAW Raw products are in the Starlink NDF format (file extension .sdf) and are instrumental timeseries files, which can be gridded and reduced using the usual Starlink software [1] and ORAC-DR pipelines.[2] The Product ID is prefixed with raw_ . [Cal. Level 0]
- CUBE [ACSIS data only] Raw-standard data that has not been fully reduced, but has been gridded into a standard position-position-velocity cube and is in FITS format (file extension .fits). The Product ID is prefixed with cube_. [Cal. Level 1]
- REDUCED Reduced data has been reduced using the standard ORAC-DR [2] pipelines, and the recipe options set for the project. The Product ID is prefixed with reduced_. [Cal. Level 2]
The product ID also tells you some other information about the observation.
- For SCUBA-2 observations it includes the waveband (450 um or 850 um, e.g. raw-450um or reduced-850um).
- ACSIS observations/reductions will include the rest frequency (in MHz) and the bandwidth mode (e.g. 1000MHzx2048 etc). You should be aware that this is the only place in the results table that the bandwidth mode is shown.
In the future, we hope to have more complex composite observations available. There are currently also a few project composite reductions visible in the archive; these were JAC pipeline-produced reductions of all observations of a given region for a given project, as requested by the PI or survey. These will only be visible if all of the component observations are publicly available, or if your CADC username is associated with the project in question.
These project products may cause confusion if you are carrying out a time-based search, as they will be returned for any search between when their first and last observation was carried out. In some cases, this covers several years. To remove these results from view, you can add a constraint on the search page to only return observations whose duration is less than 1 day long.
| [1] | The Starlink software is a large suite of astronomical analysis and reduction software currently maintained by the Joint Astronomy Centre. Please see http://starlink.eao.hawaii.edu/starlink for more information. |
| [2] | (1, 2) This is the standard pipeline used by the JCMT, for both continuum and spectral observations. Please see http://www.oracdr.org/oracdr for more information. |
Filtering results
In the results table, you can filter the results based on the value for any of the results columns by typing in the box below the column name. Simple alphanumeric values are matched exactly, and you can also use operators similar to those used in the search constraint boxes. If you hover over the filter box, a tooltip dialogue should remind you of the operator options.
- Asterisks (*) can be used as wild card operators.
- You can use ! as a not to show only values that don’t match your expression.
- < and > can be used for less than and greater than
- .. can be used to indicate a range to filter on.
For example, if you typed !SCUBA* into the filter box for the instrument column , you would hide all the rows showing files taken by SCUBA or SCUBA-2.
Additional information
There are few pieces of information that would be useful for JCMT users that are unfortunately not shown in any of the available columns.
The LSR (Local Standard of Rest) velocity of the observation is not available. If you are looking for observations with a large shift between the rest frequency and the observed wavelength (e.g. observations of higher CO transitions that have been redshifted into the HARP band), then you will need to manually add the min and max wavelength columns from the extra columns section to view this.
Currently, there is no information on the weather at the time of the observation available through the CADC. For downloaded data however, a given observation will have the start and end tau written into its FITS headers.
Available columns that may be of interest to JCMT users but are not currently shown in our default column list include: Proposal Title, PI name, Data release (date the object becomes publicly available).
Downloading results
In order to download files, you need to select all of the rows you are interested in using the check boxes in the far left column. You can also choose which type of file you want returned – Science, Calibration, Auxiliary, Info, Preview, Catalog, Noise and Weight.
For JCMT results, a map, cube or raw file will be downloaded if either Science or Calibration is selected as appropriate. Our noise information in reduced maps is included in the variance array within the same file, so they cannot be downloaded separately. The only additional files we currently ship are Preview images. For each reduced product you choose to download, selecting this option will include the representative map and/or representative spectrum in FITS format in your download. These are the same data that are used to create the Preview Images in the results.
Clicking the large green download button above the results will then show you the different download methods available:
- Java Webstart, a java based GUI-interface that will automatically download the files to your chosen location.
- A list of URLs in a file that can be downloaded using programmes such as wget or curl.
- A clickable list of html links, one per file to be downloaded.
You can then use your chosen method to download the selected data, and optionally save your method as the default.
- a single raw SCUBA-2 observation can consist of a very large number of individual files, so the html links on a webpage may not be an appropriate means of downloading these. The wget or java options should be more user friendly.
- Currently CADC have a warning about some issues with using wget to download files. If you are having trouble with this option, please check their advice, shown on the bottom half of the Choose one of the following download methods page.
- If you use the java Webstart option, be aware that your computer’s security settings may block the programme from running. At least on recent Mac OSX machines, you will need:
- to be able to run programmes from unknown developers. This can be set under System Preferences->Security and Privacy->General->Allow apps downloaded from Anywhere, or by downloading the file, opening its location within finder, and using the right-click menu to select Open With... Java Webstart.
- AND separately your java installation will need to allow the programmes from the CADC website to launch. This is set by going to System Preferences->Java->Security and adding http://www.cadc-ccda.hia-iha.nrc-cnrc.gc.ca to the list of exceptions.
Tips
- In the additional constraints section, you can select multiple fields (e.g. to select both HARP-ACSIS observations and SCUBA-2 observations) by holding down Ctrl (Linux/Windows) or Cmd (Mac) while you click.
- Hovering over a search criteria box pops up a help pane for that box.
- There are a very large number of columns available in the results pane – hover over the ‘Manage Column Display’ link if you’d like to see all the available information on a result.
- You select rows to download by clicking the check boxes in the far left of the results pane (labelled Filter:); only results already selected here will be downloaded when you click on the large green Download button on the results pane.
- Browsers on some version of Mac OSX (and possibly other systems) interpret a horizontal scroll that is not within a scrollable region as a move forward or backwards within your history of that tab. If you are horizontally scrolling within the results pane of this interface using your trackpad, and continue after you have scrolled as far as you can, your browser may surprise you by suddenly jumping back a page. If you then go back forward, CADC will correctly remember your results but will no longer use the JCMT default column list. It is recommended to turn off this behaviour – this can be done by going to System Preferences->Trackpad->More Gestures and un-checking or changing the Swipe between pages option.
Known Issues
- Under the Instrument Names column you will see a lot of older JCMT instruments. Unfortunately, these are currently not correctly ingested into the CADC database, and a large amount of information is missing about them. In some cases, there will not even be available positions for the observations. Searching by more than observation date is currently very poorly implemented for these older instruments and is not recommended. We are planning to make these more usefully available in the future.
- The Time Dependent column is not currently being filled in. As a result, there is no consistent way to filter out observations of moving objects, such as planets or comets. For most cases, it will be easiest to look at the Target Name column. This is not guaranteed to be a standard name (it is whatever the original observers chose) but in most cases it is. If further information is required, the Proposal Title column frequently gives a hint as to what the observations might be.