


The summit of Mauna Kea benefits from having its very own weather forecast provided twice daily by the Mauna Kea Weather Center, administered by the UH Institute for Astronomy in cooperation with the Department of Meteorology. This forecast, along with a plethora of other information, is compiled on the EAO Weather page.
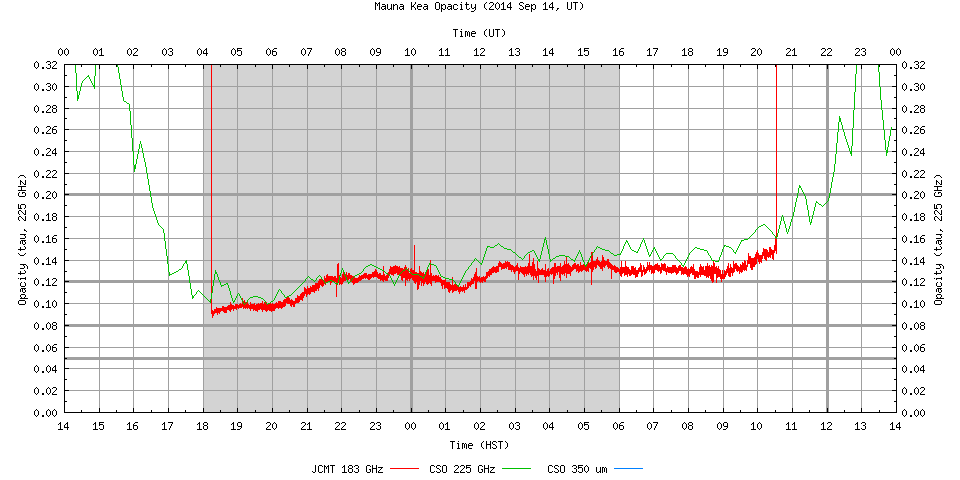
At submillimetre wavelengths, the appropriateness of observing a given project is defined first and foremost by the atmospheric opacity due to water vapour. An approximately linear relation exists between the measurable precipitable water vapour (PWV) in millimetres and the opacity at the JCMT instrument wavebands. This PWV is measured both by the adjacent SMA (formerly the CSO) radiometer at 225 GHz and an in-cabin line-of-sight 183 GHz radiometer (the WVM), allowing the atmospheric conditions to be measured at high time-resolution. This link provides a real-time plot of the current day’s opacity measurements from both instruments, when available and on-sky. An example of a typical night is shown here
To allow for practical assessment of atmospheric conditions, the PWV in millimetres is converted into five weather “bands” or grades, and it is these grades that dictate the first-level scheduling constraints for a given project.
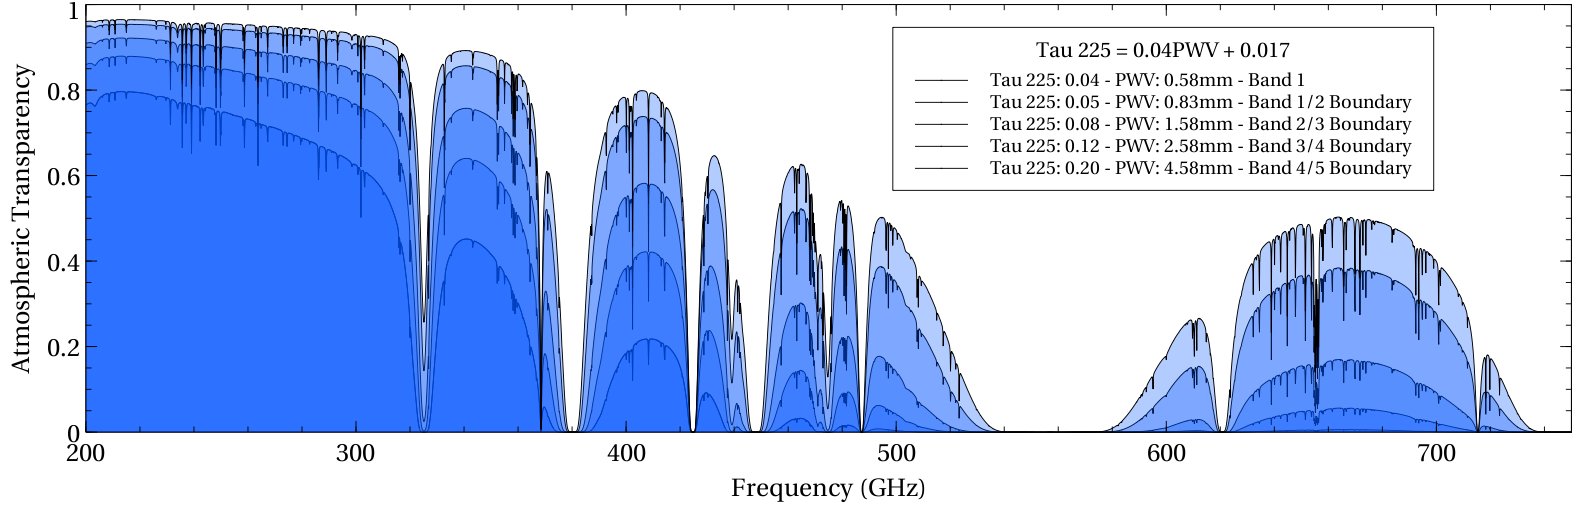
As the opacity increases, more time is required on sky to reach the same sensitivity at a given wavelength. The transmission varies strongly with observation wavelength. The 450 micron atmospheric window requires much drier conditions to be an effective observing band.
The CSO has an Atmospheric Transmission Interactive Plotter. It can be used to find the transmission at a certain frequency and amount of precipitable water vapour. Note, the conversion from Tau225GHz (which can be obtained from any JCMT fits header) to PWV is given in Dempsey et al. 2013:
Tau225GHz = 0.04 PWV + 0.017
The JCMT weather bands are defined as follows:
Band 1
225 GHz opacity τ < 0.05 (less than 0.83 mm PWV)
Band 1 conditions are the driest on Mauna Kea, and most typically seen in winter months. Band 1 conditions translate to transmission of better than 82% at 850µm and better than 28% at 450µm. Such conditions are necessary for the shortest wavelength observations, and for deep, high sensitivity observations of faint sources as well as polarimetry.
Band 2
225 GHz opacity 0.05 < τ < 0.08 (0.83 mm < PWV < 1.58 mm)
Band 2 conditions are classified as dry and translate to 850µm transmissions of approximately 77% and 450µm transmissions of approximately 19 %. Whilst bright source 450µm observing is still possible in this band, it is also extremely good for high sensitivity 850µm continuum, polarimetry, and spectroscopy.
Band 3
225 GHz opacity 0.08 < τ < 0.12 (1.58 mm < PWV < 2.58 mm)
Band 3 conditions are still very useful for a range of astronomy with the JCMT. They translate to 850µm transmissions of around 67 %. However, 450µm transmissions fall to approximately 7%. Bright 850µm targets are often observed in this band, including large-scale continuum and spectroscopic surveys of the galaxy, as well as fainter, high-sensitivity 230 GHz spectroscopic observations with HARP and/or `Āweoweo.
Band 4
225 GHz opacity 0.12 < τ < 0.2 (2.58mm < PWV < 4.58 mm)
Band 4 conditions translate to 850µm transmissions of approximately 53%, but the atmosphere is virtually opaque at shorter wavelengths (450µm transmissions ~2%). However, extremely good science can still be achieved in these conditions, including bright, galactic CO(3-2) spectroscopic surveys at 345GHz with HARP and/or `Āweoweo, and at longer wavelengths with `Ū`ū, our 230GHz receiver.
Band 5
225 GHz opacity τ > 0.2 (more than 4.58 mm PWV)
Band 5 conditions are considered to be very wet (by Maunakea standards). They translate to 850µm transmissions of less than 45%, and the atmosphere is virtually opaque at shorter wavelengths (450µm transmissions ~ 0.5%). Again, however, good science can still be achieved, including bright, galactic CO(3-2) spectroscopic surveys at 345GHz with HARP and/or `Āweoweo, and at longer wavelengths with `Ū`ū, our 230GHz receiver.
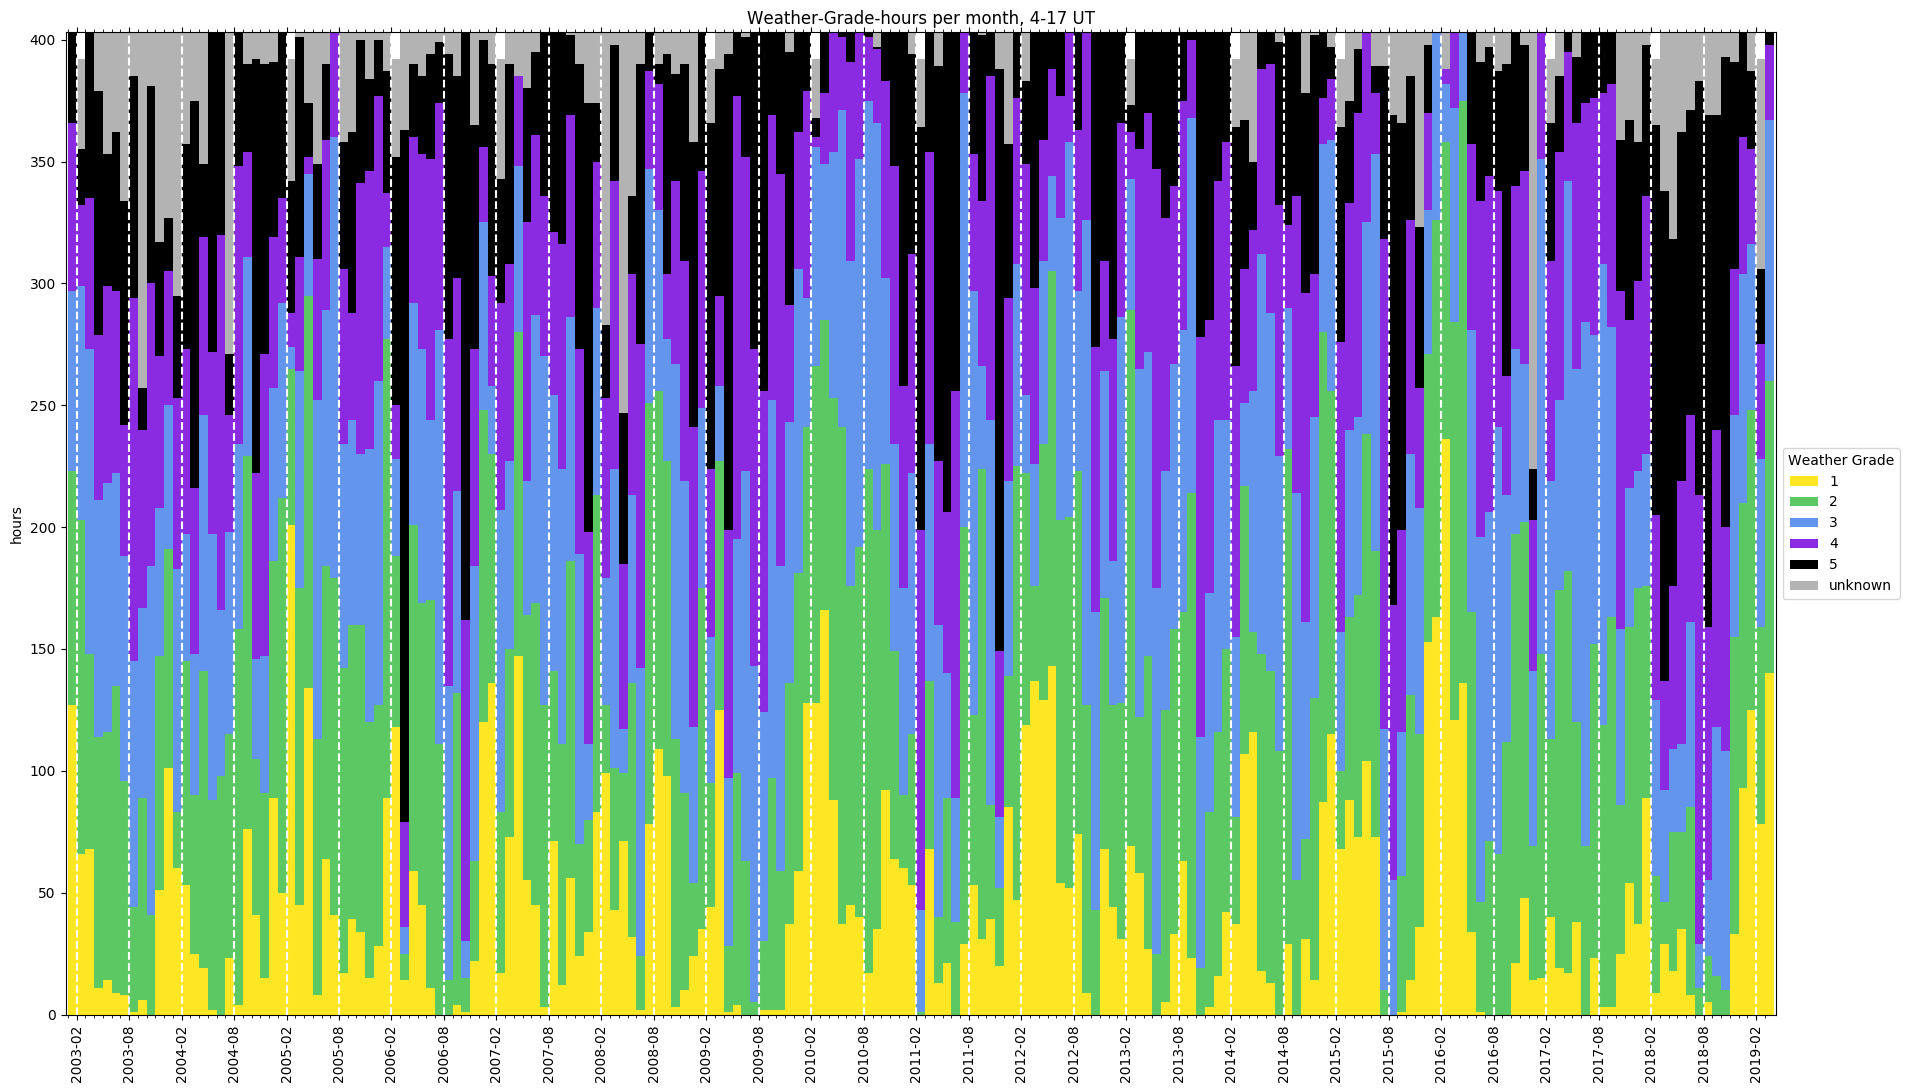
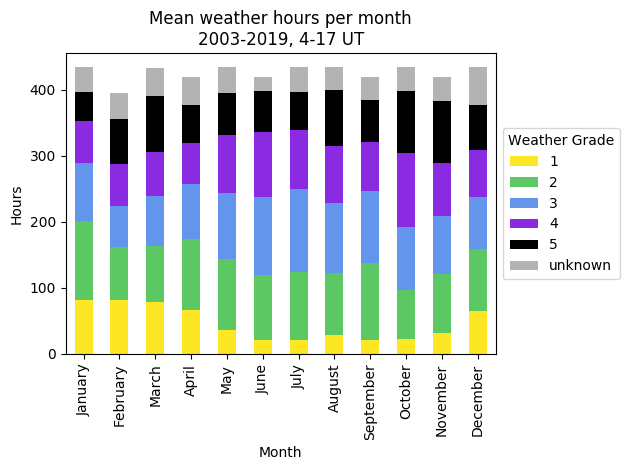 This plot collates the typical number of hour each month that the opacity is measured in a particular band, averaged over a 13 hour night that matches our ‘typical’ shift, 0400 to 1700 UT (1800 to 0700 HST). The mean value over each hour is taken every night from 2003 to the start of 2019. This does not include closures.
Summer months on Maunakea tend to be wetter than winter months. For example, during average winter months (Dec-April) 15 – 25% of the time is Grade 1, while in summertime the fraction can be less than 5%. Good weather is more frequent during El Nino. At least 15% of the time we encounter Grade 5 weather, and as much again is lost entirely to bad weather.
The following plot shows the mean number of hours in each band for a given calendar month from all of
the years with the white dashes indicating the Semester A and B boundaries.
See also Seeing.